There is always contention over how much ‘big data’ should be our (the shopping centre industry) concern or whether we should leave it to the retailer. It used to be an expensive exercise but now, using big data can cost a fraction of what it used to. This article articulates the need for big data in property decisions.
This article by Jason San Diego, Founder and CEO of Pathzz was first published in SCN Vol. 39 no. 2 CBD Guns issue

For the past 14 years, I’ve been focused on the mobile and digital advertising industry where big data and machine learning is applied in microseconds to ad campaigns to optimise campaign performance and drive customer business outcomes. The key themes that evolved over this time are ‘big data’ and ‘machine learning’. Entering the prop-tech market, I’ve noticed a great need for these principles to help drive impactful and timely decision-making for the commercial property industry.
In the rise of the digital age, data has become a driving force to measure the performance of shopping centres and to develop insights as to how centre owners and retailers can optimise their business activities. Data has become more accessible and technologies have emerged to enable the processing of large data sets into meaningful insights facilitating this growth in the importance of data.
From tenant management, valuations and site selections among many other activities, processing data sets into meaningful insights to drive decision-making has never been more achievable. The increased availability of data presents new challenges, specifically the time and cost to generate actionable insights to drive outcomes.
Managing data and transforming it into a medium through which shopping centre owners and retailers can make informed decisions is one of the most challenging aspects of the shopping centre industry today. Faced with the challenge of compiling internal data sets such as rents, revenue and other information, with external data sets such as movement/location data, census and ABS household expenditure and age groups, customer surveys and other third-party data sets, centre owners, managers and retailers will employ labour-intensive teams of analysts to both source and process this information at great cost and time outlay.
Many will have the additional cost of geographic information systems (GIS), cloud and database software to add against the external data sources costs to process the data into something meaningful. The time to process can range from weeks to months, creating distance between the time when the data occurs to when the insights can be actioned.
In many cases, the data sets can be incomplete or only reference a single centre, making it difficult to benchmark the data against a national, or more distributed set of shopping centres, limiting the view of how customers are interacting with your centres on average against your portfolio.
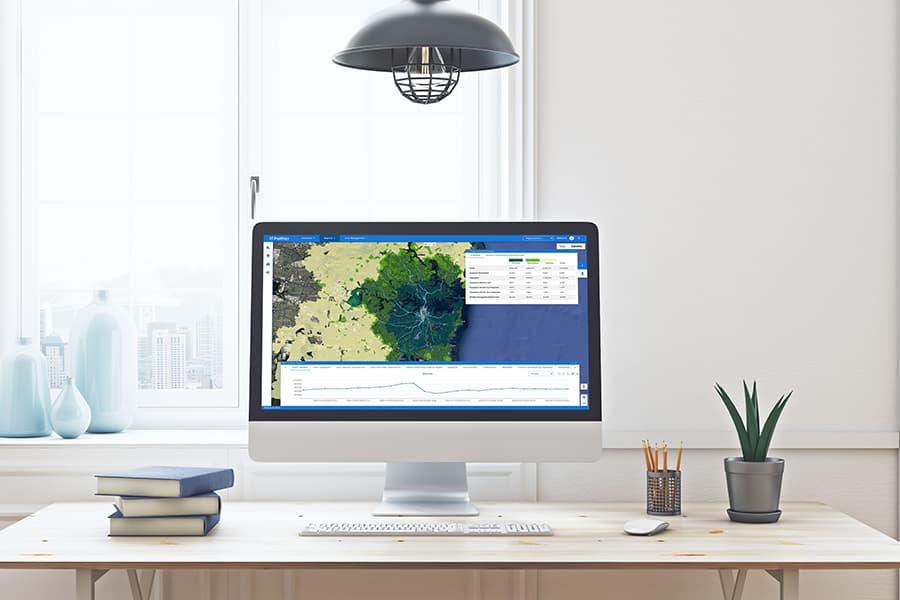
Pathzz can be used to monitor the resurgence of suburban Sydney retail precincts
For example, spot purchases of raw external data on transactions and location/movement data for one shopping centre or area will typically yield a narrow view of total consumer behaviour across neighbouring owned assets, greater portfolio assets of the same class located in other states or regions, competitor assets, transport, exercise, demography, income, expenditure, brand affinity and other consumer behaviours of interest. However, typically the cost to access a national or at least a regional view of data makes it inaccessible from both a raw data cost, human labour to manage it and software to process and visualise the data into summaries and smaller units to analyse. This leaves the industry with a relatively high cost of labour, raw data, software and time outlay to generate and deliver meaningful insights to decision-makers, adding a layer of risk in terms of dollar cost and delay in action taken by centre owners and retailers to affect meaningful change when it counts.
The challenges of cost, labour requirements and time to process data have all been addressed in the digital advertising industry by employing big data processing and machine learning or artificial intelligence (AI).
In the digital advertising industry, the decision to serve ads is made by machines in micro-seconds and extensive big data processing has been applied to assign audience targeting characteristics and profiles at an ad inventory/publisher level and even at an individual user level. Furthermore, reporting and analytics can be generated in real-time or within 24 hours (at the latest) of an event occurring, to ensure that ad purchases can be optimised towards customer business outcomes, like online purchases, product availability, app installs, lead generation or store visits.
Considering the fast and precise nature of how big data processing and machine learning has been used to drive business outcomes in the advertising industry, the commercial property industry can apply the same technologies to:
- Gain a more complete view of its customer
- Lower the cost and time required to generate meaningful analytics
- Give your analytics teams a greater focus on interpreting data and generating insights rather than processing it
- Give decision-makers the opportunity to react to changes in customer behaviour regarding their retail locations at the right time
- Target customers and prospective customers with relevant marketing materials and methods
- Make better choices for your tenant mix as your customers’ needs change
- Identify overperforming, underperforming and undervalued assets
- Monetise the customers in your centres by building profiles for advertising and promotional activities
- Select new retail or centre locations based on real customer behaviour.
Here are some aspects of retail data management that centre owners, managers or retailers should consider when developing a data program:
Utilise data sources that provide a national and regional view of customers at a local level: Develop data sources that show customer behaviour at a retail park, store or shopping centre as well as a national/regional view of their activities such as overall brand affinity, overall cross shopping habits. This way, you gain a view of what customers do within your retail centres and outside of them.
Use software that simplifies data sets into easy to process units: Work with data providers that can simplify large data sets into easy to ingest and process units (eg. take billions of location signals from mobile devices and summarise them to counts against stores, profiles and statistical areas).
Use software that can process data daily or weekly: Maximise your data refresh cycle to enable a timely review and response to consumer trends. Quarterly and yearly refreshes are too long from when the events occur to affect meaningful change.
Use diverse data sets: Ensure that your data sets possess multiple dimensions to give you a more complete view of how customers interact with your centres and the world around them – visitation data, brand affinity and customer profiles can be used to forecast the performance of new centres or stores, or to identify new acquisition opportunities.
Use software and data sets that can apply benchmarks to your portfolio and your competitors’ portfolio: Benchmark data against time, centres and retail parks to get a comparable view and identify under and over performing assets to inform centre and retail strategy as the trends occur.
Using big data processing of mobile location data combined with other data sources and machine learning, we have generated the following insights at a fraction of the cost of processing such insights through labour intensive methods, delivered in five seconds:
- Visits to the Sydney CBD have increased 20% from January 2021, to February 2021
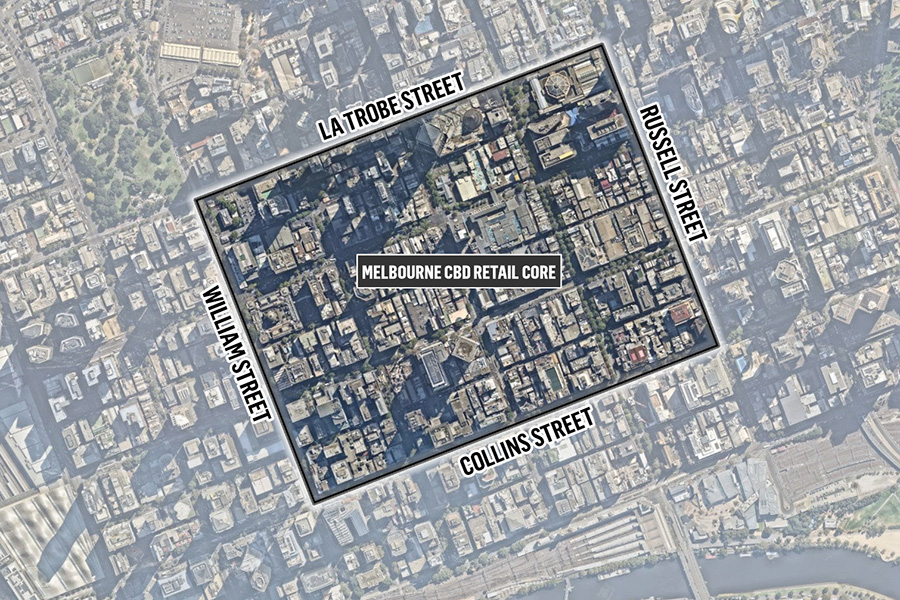
- Visitors to Sydney CBD aged 20-34 have dropped by 9%, and visitors to Melbourne CBD have dropped by 11% from Jan-Feb 2020 to Jan-Feb 2021 (pre-COVID and post-COVID)
- Visits to the CBDs by people aged 35-60 have increased by 8% in Sydney and 10% in Melbourne
- Wednesdays and Thursdays hold the most visits for both CBDs yet Friday is making a comeback YOY as restrictions lower.


