This article prepared by Jason San Diego, Founder and CEO of Pathzz and Matt Copus, Head of Retail Analytics, CBRE, was first published in the latest issue of SCN – July/August edition
Consumer behaviour has changed and will change further still. As investors you need to ask yourselves how comfortable you are making investments without a wholistic view of how this change is impacting your current assets and prospective investments?
Making investments before the Digital Age was largely intuition based and referenced static points of data that varied in their veracity and accuracy. Data was a lower priority in investment decision-making but this has changed with the times with great effect.
Today we can leverage a myriad of internal and external data sources such as rent yields, sales figures, census and population demography statistics, transaction data and location data to name a few. Most importantly, these data sets are now stored digitally and more frequently through the use of technology, giving property owners and retailers what they need to build a dynamic data program to inform their decision-making. Internationally, leaps and bounds have been made in the area of Next Generation Location Analytics. It has become the digital technology medium through which a vast array of data sources have been combined and transformed into insights to drive optimal investment decision-making.
A cautionary tale
Randall Park Mall in Ohio could briefly claim the title of the world’s biggest shopping centre when it was opened by the DeBartolo Realty Corp back in 1976. This ‘city within a city’, boasted five anchor stores, 200 shops, a cinema, a performing arts centre, three 14-storey apartment blocks and two 20-storey office towers. Occupancy was as high as 92% by 2000 under the experienced management of its new owner, the Simon Property Group. But then many of the anchors began losing their way and started filing for bankruptcy. By 2004, occupancy was at 50% and the centre was sold for US$6 million, a fraction of its peak valuation. The new owner began backfilling the vacant space with furniture retailers and non-retail uses including a 20,000m2 education facility. But by 2009, Macy’s and Sears had finally shut their stores and the mall was permanently closed soon after. Randall Park was finally demolished in 2018 to make way for an Amazon fulfilment centre.
Randall Park is of course an extreme cautionary tale of the decline in US shopping malls and of course many factors contributed to its demise. But at the heart of matters, the centre simply lost its customers. The consequence being that one of the world’s largest shopping centre owners saw one of its assets become essentially worthless on their watch.
What Simons Property Group needed was a holistic view of how people interacted with Randall Park and its competitors. Perhaps if Next Generation Location Analytics, as it is today, was around in 2000, then a small investment in customer insights could have prevented a multi-million-dollar loss.
How technology can help
Next Generation Location Analytics use location mobility data to deliver a level of insight never seen beyond what most investors would think possible.
By way of example, the use of Pathzz by CBRE Asia Pacific has provided a living view of how consumers and shoppers interact with physical locations across Australia. The insights this type of technology generates about a property, precinct, city centre and beyond are based on a sample of aggregated mobile signals that provide insights into the behaviour of the residents, workers and tourists present in these shopping locations and other locations across Australia.
Before Next Generation Location Analytics was available, the only way to understand consumer behaviour was credit and debit card data, if you were willing to pay the eye-watering fees charged by the banks for access to their customers’ transactions. Even with its exorbitant cost, this data provided little resolution to all but the largest shopping centre owners and was incapable of providing insights on individual tenants or competing locations due to the heavy restrictions imposed by the banks.
This left most investors with a traditional location analytics report on the demographic data of an abstracted trade area, an information source that is stale before it is published and provides no insight into actual customer dynamics.
Of course, no Australian investor wants nor can afford a ‘Randall Park’, and we can take comfort by saying that it could never happen here. But in a space of less than ten-years Randall Park went from a productive asset to worthless, and we live in extraordinary times. The question investors need to ask themselves is do they understand the customer dynamics of the asset they are about to invest in? Without the customer, your investment is worthless.
Next Generation Location Analytics technology in action
This technology is being actively used by investors to minimise risk and amplify returns. In the first instance it provides customer level due diligence. It will answer questions like:
Where do your customers come from? What are their needs? How significant are competitor impacts? And how has this changed over time?
These applications are also being used to search for underperforming assets that the investor knows they can turn around with a remix, refurbishment, improved management and possible development.
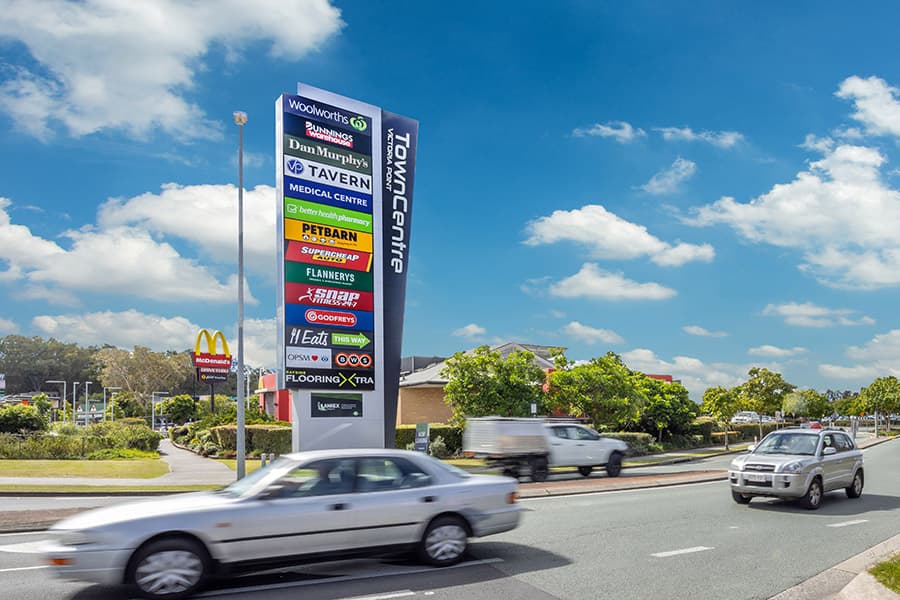
Let’s look at the recently transacted TownCentre shopping centre in Victoria Point, Queensland. Neither Pathzz or CBRE were involved in this transaction, but we thought it would be a good subject, given the recency of the transaction and the complexity of the location.
If you’re not familiar with the asset, HomeCo made the news recently with the purchase. The centre is anchored by a Bunnings and Woolworths with an array of fresh food specialties, fast food restaurants and large format retailers. The centre is part of a much broader offering, but is also trading alongside Victoria Point Shopping Centre, Victoria Point Lakeside Shopping Centre and an ALDI. So, this is a great case study to understand shopper movement and where the cross over is between the three locations.
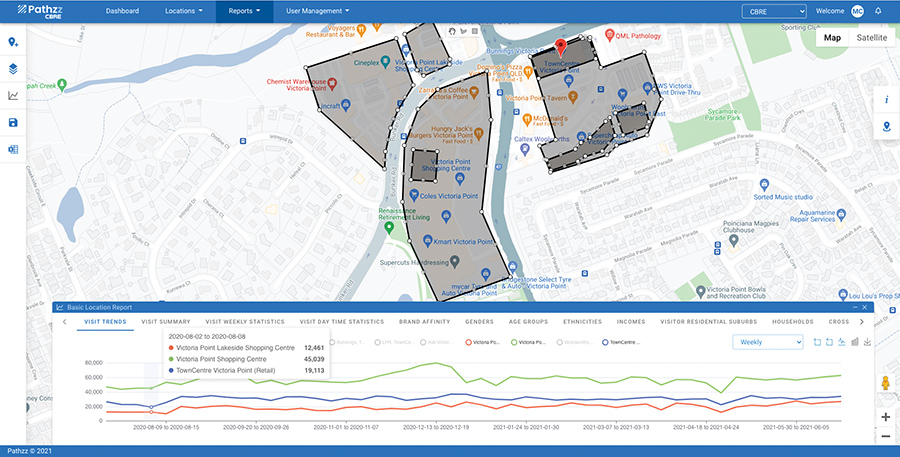
Map 1. Defining Custom Locations
Defining locations
To better understand the customer dynamics of the TownCentre shopping centre, we needed to know how customers interacted with the broader retail offer. We used Pathzz to do this as it allows us to define custom locations (see Map 1) to then understand the number and types of people that visit these locations, and then the cross visitation between these locations.
For this analysis, we looked at TownCentre and then further defined the Woolworths, Bunnings and the large format component. We also looked at Victoria Point Shopping Centre, Victoria Point Lakeside Shopping Centre, the ALDI and the Woolworths at Victoria Point for comparisons.
Getting the insights
A short summary of what we learnt from our analysis:
• Victoria Point Shopping Centre is the main traffic driver to the area, with Kmart a major draw
• ALDI is outperforming the two Woolworths supermarkets combined, and the Woolworths at Victoria Point is serving twice as many customers as the store at TownCentre
• About one-third of TownCentre customers will visit the Victoria Point Shopping Centre on the same trip, and one in 20 will visit ALDI
• Bunnings and Woolworths draw in the same volume of shoppers to TownCentre, but these customers are more likely to visit Victoria Point Shopping Centre and Lakeside Shopping Centre than visit another tenant in TownCentre.
So we could argue that TownCentre shopping centre is somewhat disjointed with its tenancies not supporting each other and instead trading off of neighbouring retail destinations. As our analysis reveals though, this relationship with the broader retail adjacencies has created a huge trade area.
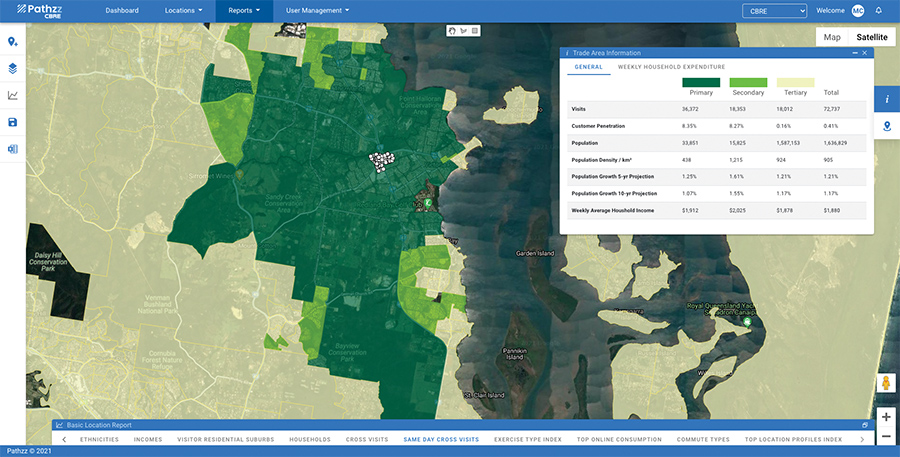
Map 2. Real trade areas in real-time
Real trade areas in real-time
Next Generation Location Analytics technologies can calculate trade areas in near real-time using visit data from as recent as last week. This lets us move from static yearly or bi-yearly trade areas to dynamic trade areas defined by actual customer behaviour. Using this method, we can see that by virtue of its relationship with Victoria Point Shopping Centre, TownCentre achieves a customer penetration of 35% across an extensive main trade area that is only halted to the south by the Bayview Conservation Park and to the north by retail offers at Capalaba, Alexandra Hills and Cleveland.
However, that’s not the full story because, as is often the case, the trade area only tells part of the story. The results show that 20% of visits to TownCentre come from beyond the main trade area and, as Map 3 highlights by plotting the journey paths of visitors to TownCentre in the hour before and after their visit, many customers are using the centre to stock up on supplies before they head off to North Stradbroke or the number of other islands off the coast.
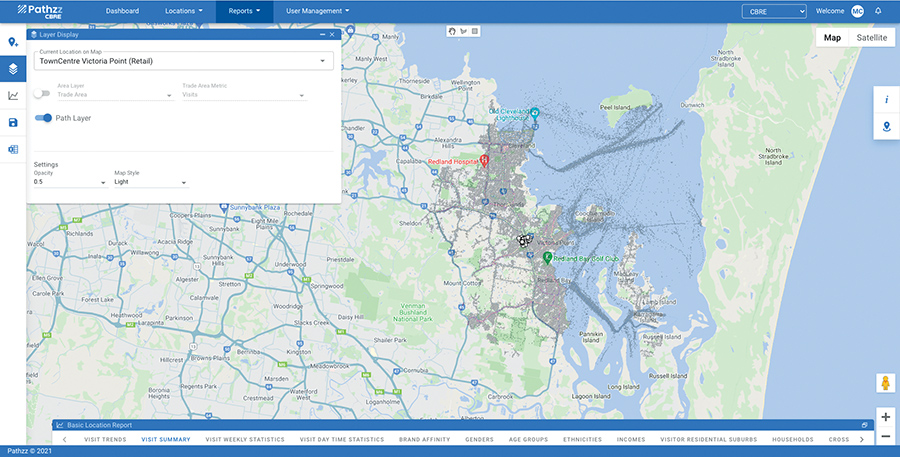
Map 3. Journey paths of visitors
Identifying opportunity
This analysis has revealed that at TownCentre there is an abundance of opportunity, and we’re sure this is what HomeCo saw in the investment as well. They have quality tenants trading in a shopping centre that leverages off a much more powerful neighbour. There is only upside for an active management team that will remix and develop the site over the coming years.
Growing your investment
Next Generation Location Analytics technology and data plays an important role in improving centres. It provides a rich array of AI enhanced demographic and behavioural attributes about actual customers.
This ranges from something as simple as age and gender to a detailed view of the brands they shop at and the exercise activities they partake in. Using data, you can not only understand the tenants your customers want, you can also present the evidence to secure the right tenants at the best terms.
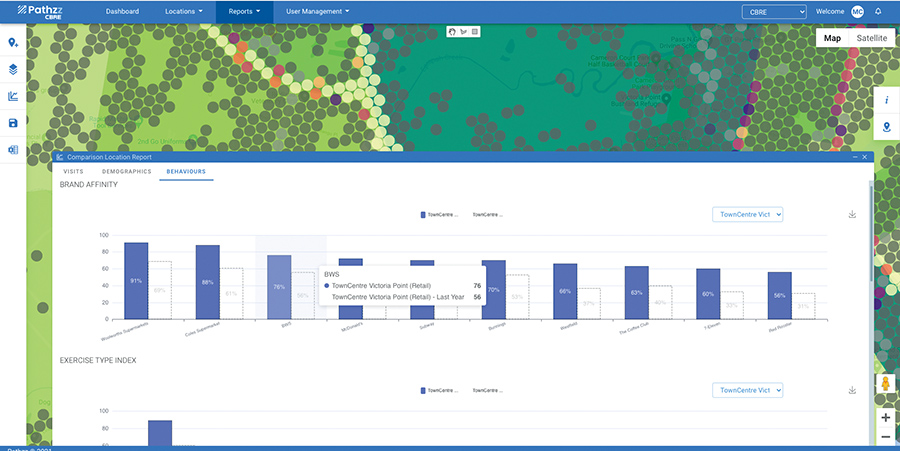
Next Generation Location Analytics technology provides a rich array of AI enhanced demographic
It has also enabled us to measure performance in near real-time. We have been able to help investors by mapping data across the subject of the investment and its competitors to realise and measure the full potential of a commercial investment. Specifically, we are able to report on changes to market share (share of visit) by analysing battleground suburbs and the cross visitation of consumers to adjacent developments.
In summary, Next Generation Location Analytics technology has earned its position as a mainstay in our evaluation of commercial real estate investment opportunities. We believe that investors must adjust their methods to incorporate this technology in order to stay in-step with consumer behaviour change; the only thing that remains a constant.


