Talk about data collecting, big data collecting and it all gets a bit 1984ish. Where you go, what you buy, how long you stay, what you look at is all recorded, slotted, filed and brought out to sell you something. It’s part of today’s world, but we’ve got to know how to use it.
Technology, that gathers real-time shopper tracking data and behavioural insights, provides shopping centres access to data that will result in an improved and better customised shopping experience for its customers.
In today’s world, where consumers’ shopping habits are constantly evolving, it is important that centres understand who their customers are, and how they can enhance their customers’ weekly shopping experiences.
Shopping centres across the country can now build a detailed view of their customers’ shopping behaviour through shopper data captured in real time, overlaid with data analytics. This will help shopping centres improve centre loyalty, create better shopper and community engagement, and optimise sales for centres overall.
Improving shopping centre loyalty
A recent survey of 5,600 Australian shoppers in their neighbourhood centres revealed that 51% of people have not visited any other centre in the last two weeks to do their grocery shop, which shows a strong level of loyalty. These findings also indicate there is a huge potential for neighbourhood shopping centres to increase traffic by improving conditions for the remaining 49% of people who aren’t as loyal to the centre*.
Outdoor shopper behavioural analytics that generate a real-time heat map of the consumer’s usage and movement around the centre, can help shopping centres better manage the operational needs of the centre from key times for trolley collection, to cleaning of amenities, to the allocation of tenancy. Traffic flow data will, over time, reveal not only the stores that drive consumers to use the centre, but also those that encourage people to stay longer, in addition to mapping out typical centre journeys by shopper types.
By providing shopper analytics to our centres, we’ve found that the overall trend across our neighbourhood centres Australia-wide reveal a key trading pattern that commences at 8am, peaks at midday and continues through to 5pm, with a dip around 3pm during the school pick-up period. Weekend trading typically starts at 10am, with a consistent level of activity through until 4pm. But every centre is different and many will have significant differences that are specific to their location and customer needs.
We have one neighbourhood centre that is located across the road from a train station so its trading hours are very different, with trading starting at 7.30am, peaking at 4.15pm and continuing through to 7pm. The centre’s traffic flow directly aligns with the commuting patterns of those using the train station. This has led centre management to not only adapt its operations around these hours, but also to share this intel with its retailers, so collectively they can offer service that is more efficient and better quality for those visiting the centre. Data is critical to the success of any business and the data and insights we provided enabled them to connect better with their customers to build loyalty and advocacy for the centre.
Creating greater shopper and community engagement
Deloitte’s 2016 Mobile Phone Consumer survey revealed that 59% of Australians would rather connect their smartphone to wi-fi instead of their mobile network, providing both an opportunity for shopping centres to connect directly with their consumers, and also better understand them through the capture of data when free smart wi-fi technology is installed as part of digital panels.
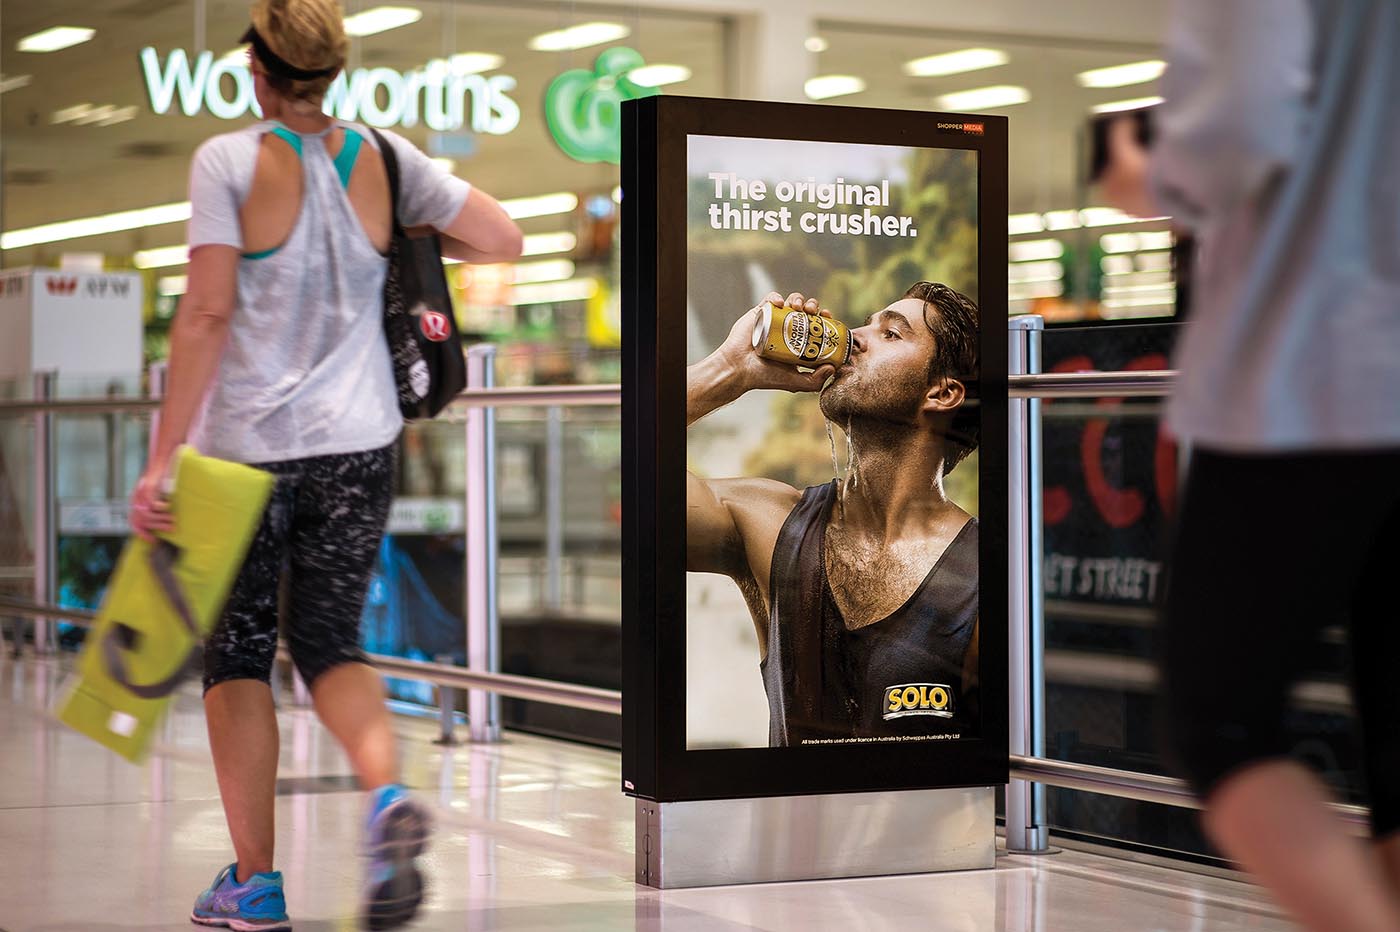
The dynamic capability of the digital advertising panels enables relevant and localised messaging to be served up to shopper audiences at relevant times of the day.
The creation of real-time and dynamic messaging will start to become a huge point of difference for retail digital advertising panels, as it will enable shopping centres to speak with customers in a localised and personalised way, and therefore ensure that advertising is as relevant as possible.
Centres should also start thinking further about how to enhance the shopping experience and build community engagement through sharing useful relevant information tailored to their shoppers, such as local event information, local team sports scores, local weather and traffic conditions.
This would assist building greater centre community and customer engagement, and ensure that the information and advertising provided on the digital panels and to a consumer’s mobile is as relevant as possible and complements their shopping experience.
Optimising shopping centre sales
Extending beyond purely means for driving brand awareness, digital retail panels are now a powerful driver of product purchases, as it influences the shopper’s journey at the point of purchase.
A recent survey conducted by Shopper Media Group on confectionery products revealed that 30% of 3,434 Australian shoppers surveyed cited shopping centre panels as their primary media information source for new products, followed by 16% who stated print advertising (11% catalogues and 5% magazines), with 8% selecting television advertising**.
The data collected indicates that a strong presence within the retail precinct is the most effective channel to drive product communication and, ultimately, increase the rate of sale for retailers.
It is critical therefore, that the retail digital advertising panels are best positioned within the centre with closest proximity to purchase, to maximise conversion for advertisers.
In summary, retail digital panels are no longer simply a tool for advertisers, but are a critical data and insights resource for shopping centres across the country wanting to adopt best practice for the centre, by improving centre loyalty, creating enhanced shopper and community engagement, and overall optimising sales for the centre and their retailers.
Data sources:
*Shopper Data Group, Centre loyalty survey, 5,627 respondents, 1–8 February 2017;
**Shopper Data Group, Confectionery survey, 3,434 respondents, 27 May–3 June 2017.


