This article written by Noel Cook, oOh!media was first published in SCN Vol.39 No. 2 – CBD Guns 2021

oOh!media is confident about the CBDs future. Their data supports this sentiment. But, when it comes to advertising, they insist that audience targeting plays a crucial role in ensuring brands are reaching the right audience as effectively as possible.
This CBD Guns edition comes at a good time for the retail industry and represents a stark contrast from a year ago. Apart from a few temporary setbacks, Australia is recovering well from COVID as 2020’s horrors recede. Restrictions are being eased, people are travelling domestically, consumer confidence is rebounding, and shoppers are back on the streets.
While it’s great to have positive sentiment, businesses rely on hard data to make decisions, and at oOh!media we’ve been keeping a close eye on what the numbers are telling us, based on information from our data partners.
To summarise simply, the news is good – especially as it relates to CBD activity.
While many have predicted a future where large numbers of the public work from home, it looks like that will not be the case. People are returning to offices, driven by corporate team-working needs and the desire to see colleagues physically again. And while flexibility will no doubt increase, it’s our view that the worst-case scenarios of mass working from home simply won’t eventuate.
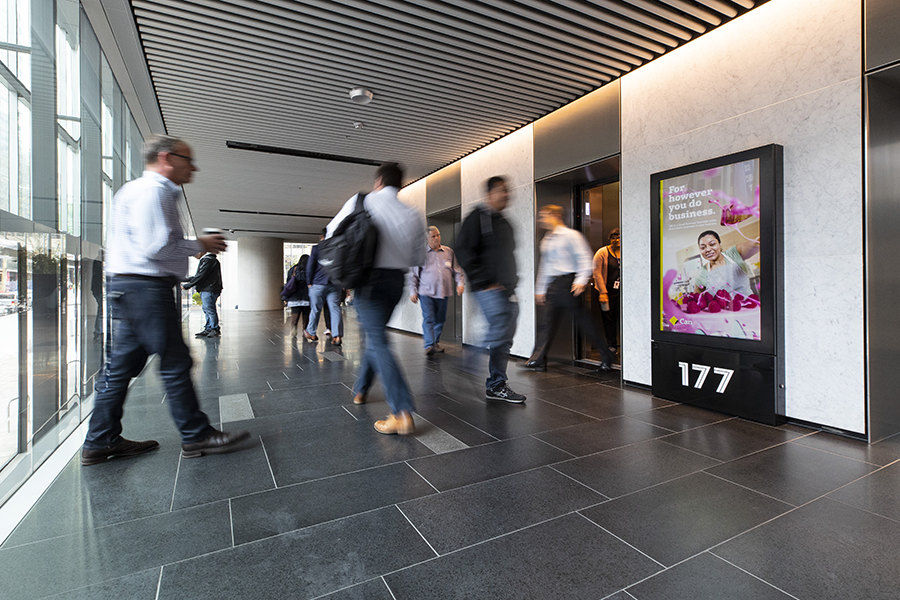
177 Pacific Hwy, Sydney
White collar professionals make up 43% of the workforce and this is the audience that was working mostly from home throughout 2020, while workers across construction, operations, retail, hospitality, healthcare sectors and more, continued to work on-site. We’re now looking at a significant increase in office numbers, demonstrating confidence in the ongoing audience return.
CBD offices filling up
Australians are back on the move and roadside and retail audiences across Australia are at 99% of 2019 levels (1), recovering to deliver 264 and 222 million contacts respectively, per week (2). CBD workers are on the same upwards trajectory, with oOh!’s DataScience capabilities recording 46.9 million contacts weekly in CBDs for workplaces across our nation, reinforcing that positive outlook (3).
This contrasts strongly with a year ago. In April 2020, travel into Sydney’s CBD dropped to a mere 17% of 2019 levels. But our latest data from April 2021 demonstrates a 69% recovery, signalling a strong return, and other major hubs in Sydney are on track too – Chatswood has recovered to 71% of 2019 levels and Pyrmont climbed to 114% (4).
The same story is playing out in Melbourne, which hit an all-time low in August 2020 at 13% of 2019 levels, but recovered to 56% by April 2021. In South Melbourne, the peak dip was reported in August at 42% of 2019 levels, and has since jumped to a 77% recovery (5).
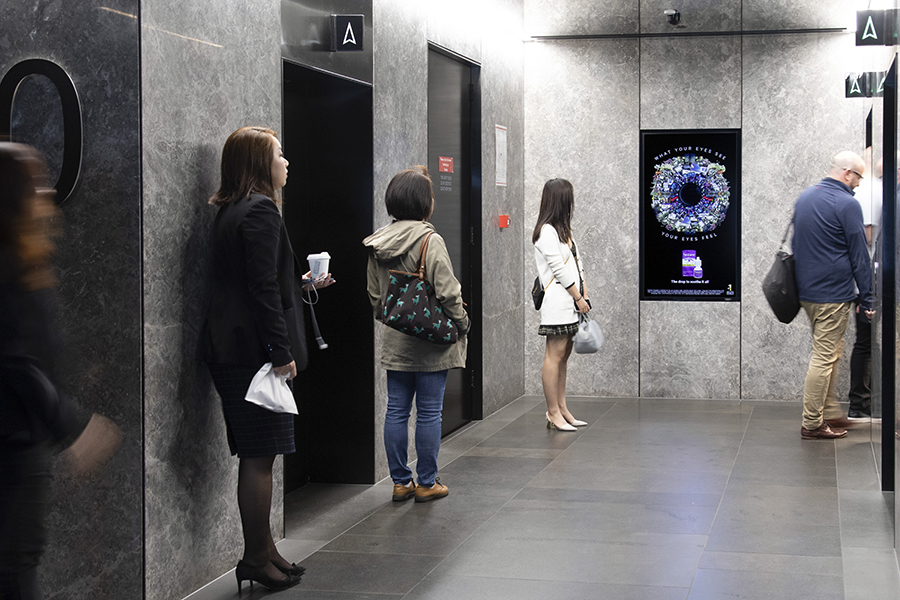
520 Collins St, Melbourne
Other evidence supporting the commuter return into CBDs can be found in the data specifically from offices and cafés. These are now at the highest contact levels since December 2020, delivering more than 110 million contacts nationwide in March alone (6).
The data debunks myths of a new WFH workplace, instead revealing a ‘new normal’ where office-based work is seen blended with WFH or flexi-working. The culture and productivity benefits that are delivered by being around your team in the workplace, surrounded by collaboration and creativity, simply cannot be replicated while working from home.
Wallets opening
During the pandemic, spending levels dropped as far as 83% below the previous year – a huge shock for centre owners and retailers that exacerbated the major issues caused by COVID and the resulting lockdowns. The encouraging news today is that this steep drop has proven to be relatively short-lived, and CBD consumers are spending again with some categories even fully recovering compared to 2019 levels (7).
It was just in February that spend on clothing retail in both Sydney and Brisbane CBDs reached 100% when compared to October 2019 levels (8), which injects a level of positivity to how consumers are spending again across our cities. This correlates with an uptick in spend across cafés, restaurants and takeaway transactions (9).
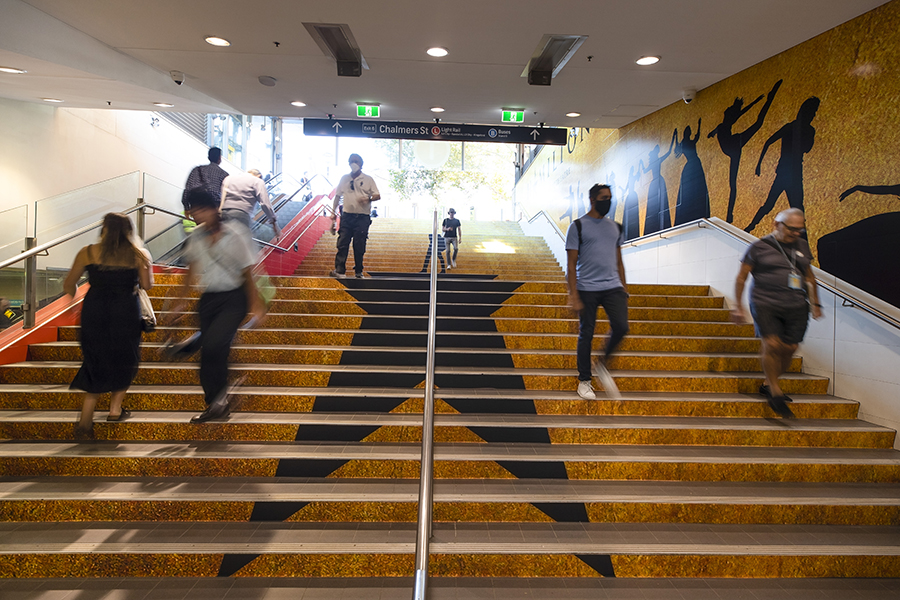
Hamilton, Central Station Sydney
Making advertising budgets work smarter
As confidence is improving, marketers are increasingly optimistic about their prospects, and are investing more as a result. From an anecdotal, on the ground perspective, our business is seeing a higher level of briefings coming in as companies ramp up their marketing spend to reach consumers again, doing everything they can to make up for last year.
These new campaigns are backed by the data outlined above, because while confidence is returning, many marketing budgets are not at pre-COVID levels, as the focus on making budgets work smarter and maximising on ROI comes into focus for all media channels. This is especially the case for international brands whose home countries may still be suffering from the pandemic, and it’s understandable that a certain caution will continue until further economic growth becomes entrenched and we move to widespread vaccinations and, hopefully, a post-COVID world.
The key now is to understand and target the right audiences as effectively as possible and identify exactly where to engage them – for example, Out of Home signs in shopping centres are often a good place to reach specific buyer categories for non-retail products, because potential customers’ movements across towns and cities can be mapped out and targeted with a multi-format campaign in and out of the centre environment.
This delivers value to advertisers, because it reaches the people they want to reach with minimal wastage of ad spend, as well as to centre owners via increased investment into the retail advertising space.
The use of data to support such campaigns and commercial arrangements will help drive the recovery in revenues for both centres and media owners as they take a more tactical approach to COVID recovery, and then build for more prosperous times ahead over the longer term.

Sources
1. Dspark data, 3,200+ Roadside and 500+ Retail locations, April 12th, 2021 vs. same week 2019
2. % Figures are across Road, and Retail aggregated weekly to total weekly volumes week ending 12th April 2021 weekly contacts
3. oOh! Smart Reach, DSpark, aggregated weekly total volumes Office and Café locations nationally from the 05-Apr 21 to 12-Apr 21
4. DSpark, audience data around oOh! office locations, period 15th March to 12th April vs same weeks of 2019
5. DSpark, audience data around oOh! office locations, period 15th March to 12th April vs same weeks of 2019
6. oOh! Smart Reach, DSpark, aggregated weekly total volumes Office and Café locations nationally, period week ending 29th of March 2021
7. NAB, Economics Data Insights: CBD Recoveries, Mar 2021
8. Quantium, Banking transactional data (electronic spend only), as of November 16th 2020 vs same week in 2019
9. NAB, Economics Data Insights Report, 10th December 2020. Based on Sydney CBD spend activity


