This article looks at the interesting research and analytics that goes into creating a truly ‘local centre’.
Today’s shopping centres no longer subscribe to the outdated model of being a place where retailers simply push their product offerings into the mass market; instead they have become the heart and soul of our local communities.
The shopping centre landscape has changed significantly during the past six years, especially for local shopping centres that now market to the needs of their increasingly unique and diverse local communities, segmented by age, ethnicity, education and experiences, to ensure they remain connected to the local shopper.
As social sanctuaries, shopping centres are places where people can undertake their convenience shop but, just as importantly, they are also places where people can connect with their local community. For shopping centres to succeed, they need a tenancy mix that fulfils the needs of the local community – and to do that, they need to know who their consumers are, and must think like the consumers they serve. Now, more than ever, the power of local is key to the success of local shopping centres.
Advanced analytics can provide shopping centres with a better understanding of who uses the centre, why, how often, and where they spend most of their time. Being able to clarify the trading patterns at individual centres is important in identifying its strengths and weaknesses – but this is just one layer of understanding. Local shopping centres also need to understand their catchment area – the source of the footfall into their centres.
Every shopping centre is different. There will be key elements, such as an anchor supermarket to service the convenience shop, but specialty shops and other community offerings will vary depending on the demographics and, just as importantly, the psychographics of the catchment areas they serve. Shopping centres need to be armed with a deep level of understanding of both to effectively build the link between social interaction, community and retail at the centre.
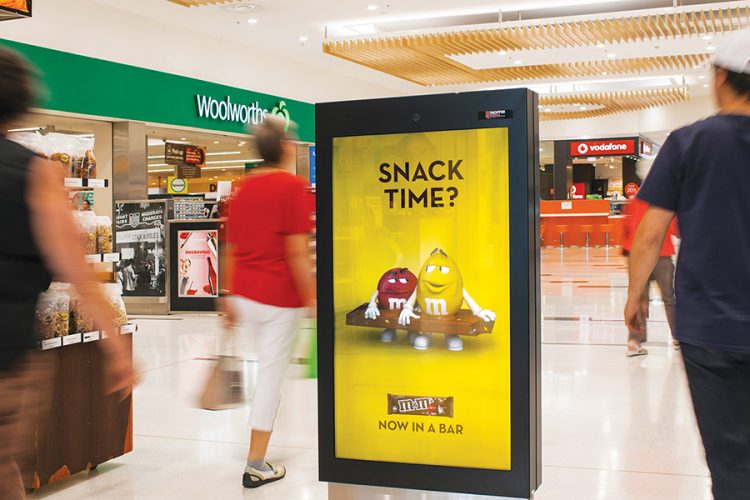
Unfortunately, some local shopping centres don’t have the luxury of access to real-time data – instead they utilise previous tenancy patterns, basic catchment breakdowns from the Australian Bureau of Statistics and local knowledge. But with turnover and occupancy key to securing a strong MAT and creating a vibrant local shopping hub, accurate catchment and centre data is instrumental in minimising the risk of bad tenancies and ensuring the mix being offered caters to the needs of the local community.
Data captured from across all of our 250-plus shopping centres nationally indicates that local shopping centres serve catchment areas that are, on average, a ten minute drive to the centre, and those shoppers will shop at that centre an average of two-and-a-half times per week.
Up until now, the analytics on the catchment areas and individual shopping centres have been two separate reads, but when collated they can reveal more in-depth understanding – and this is where the industry is starting to head.
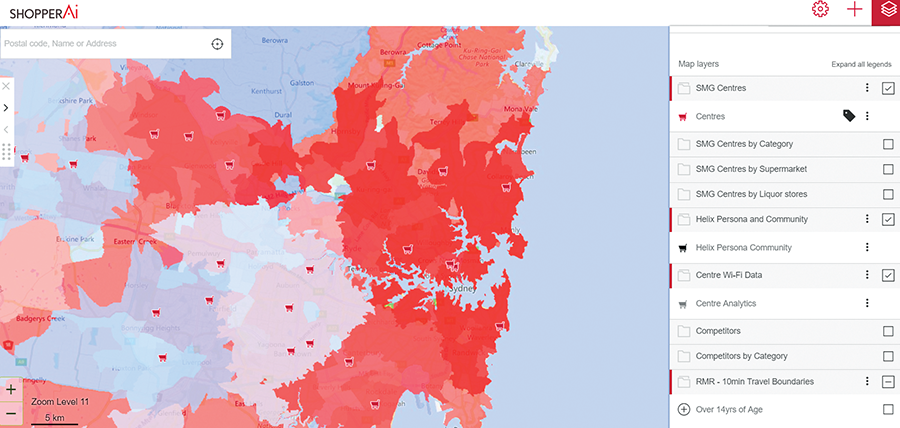
SHOPPER Ai, is a new data platform developed by SMG that collates multiple data providers, including the Australian Bureau of Statistics, Roy Morgan Research, Transaction Data from APRA, Tourism Research Australia, SEIFA, the Australian Government Productivity Commission and the real-time shopper analytics data collected by the technology platform, MIST into one data ecosystem to provide a detailed mapping of the local communities.
For example, we have a centre in Sydney’s north-west that serves a catchment area that is ten minutes’ drive time from the shopping centre. It is 203% more likely to be of Asian ancestry than the Australian average. We know a third of the catchment is considered to be an AB audience (ie. more highly educated, weathy professionals), with two-thirds being early tech adopters or tech savvy, and 70% are health conscious. The predominant psychographic of this catchment is ‘Status Matters’, so they will prefer more high-end specialty shops, cafés and restaurants.
Another centre in south-west Sydney also has a significant Asian population in the catchment area where they are 339% more likely to be of Asian heritage. In this catchment, two-thirds intend to travel overseas in the next 12 months, only 12% are of an AB background, and from a psychographic perspective, they are viewed as ‘Getting By’ and ‘Making the Rent’. For this centre, the specialty shops will be more service and discount-driven.
Both centres operate within Asian-dominated communities but their requirements will be very different as determined by the psychographic profiles. In this instance, the demographic breakdown on its own doesn’t provide enough genuine intel.
To harness an engaged community, you need to understand your catchment and centre profiles to be able to create positive experiences for your consumers. Data-driven catchment and centre mapping will become more integral in determining tenancy mix and occupancy management. Shopping centres will become better equipped at marketing – for example, the centre with the less tech-savvy profile will prefer promotional coupons over digital promotions, and in-centre activities will be aimed at supporting the meaningful connection to what matters in the local community.
Shopping centres using catchment data that is contextualised with its own centre analytics will enjoy improved operational efficiencies. They will have the ability to monitor the changes and trends impacting their centres so new strategies can be implemented to maintain the all-important connection to the local community it serves.
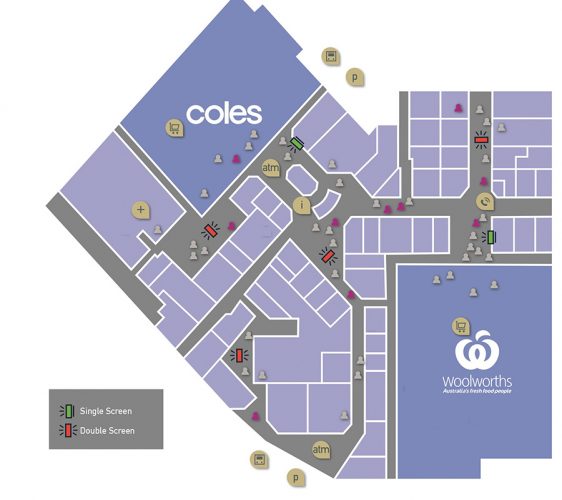
An example of a Shopper Media Group shopper tracking map


