This article was first published in Shopping Centre News – Mini Guns 2022 edition. Premium members can view the full digital issue here.

These days, we’re engulfed in data, statistics and more statistics! Recently, the 2021 Census data was released. But data and statistics in themselves can be both useless and, even worse, misleading unless expert analysis is undertaken. One of Australia’s foremost experts in this field, Tony Dimasi, is a regular contributor to SCN. His analysis of the Census is required reading for all executives in our industry.
The recently released 2021 Census from the Australian Bureau of Statistics (ABS) has 25.7 million individual stories behind it. By examining those stories, we can gain a great understanding of our society – where it sits right now, how it is changing and where it might be heading.
A national census is undertaken in Australia every five years and is something for which we should all be very grateful, particularly those of us reliant on detailed, high-quality data on the population of Australia, which of course includes anyone who is associated with shopping centres. In most countries, including the US, censuses are undertaken less frequently (typically once every ten years), and their results are often less reliable than is the case in Australia. Though the Australian Census is not perfect, the level of detail that it provides, and the geographic granularity at which those details are made available, are invaluable to those of us who are constantly in pursuit of ever more insightful location intelligence.
The 2021 Census in Australia was undertaken on the 10th of August, in the middle of the COVID-19 pandemic. The results provide us with both a stock-take of the Australian population at that point and a greater appreciation of the impacts of the COVID-19 pandemic on our society.
The first point of reference is population growth – confirming what did or did not happen in the approximately 1.5 years from the commencement of the COVID-19 pandemic in Australia through to the census date. Net migration to Australia was halted in early 2020, having previously contributed in the order of 250,000 new migrants each year, including students staying longer than six months, who are counted as part of the resident population. There were also many instances of migrants living in Australia, particularly from Asia, returning home when the pandemic hit, while the reverse – Australians who were living overseas returning home – also happened. Many of the migrants who left Australia were tertiary students.
During the past few years, we have also heard many stories and opinions about intrastate population movements across Australia as well as movements from metropolitan areas to regional cities and towns. The census results show us the net outcomes of all these varying impacts and influences.
The first notable point is that the total population increase over the intercensal period 2016-2021 for Australia was still substantial at 1.5 million – though some 350,000 fewer than the 1.85 million increase recorded over the previous intercensal period 2011-2016.
Compared with pre-COVID projections of where our population was expected to be in 2021 (ie. 26.1 million), the actual national population as recorded in the Census (25.7 million) was approximately 400,000 fewer.
In retail expenditure terms, that’s worth about $6 billion per annum or 1.5% of the national retail expenditure pie, which is now approaching $400 billion. The lower-than-expected national population, however, was more than offset by the large stimulus in retail expenditure that occurred during the COVID-19 period, with total Australian retail sales jumping by 9.2% in 2020/21 and further increasing by 5.9% in 2021/22. Of course, much of that increase was directed online; however, in the majority of cases, it was the same bricks-and-mortar retailers, through their online channels, that enjoyed the benefits.
So, the lower than unexpected population growth due to the COVID-19 pandemic did not result in a smaller than expected retail pie, rather the reverse was the case. Not all retailers shared in this larger pie equally though, while the costs of operation also increased significantly as a result of the pandemic.
Looking at the distribution of population growth across states, cities and regions, discrepancies in outcomes versus expectations between Victoria/New South Wales and the rest of the country are readily apparent.
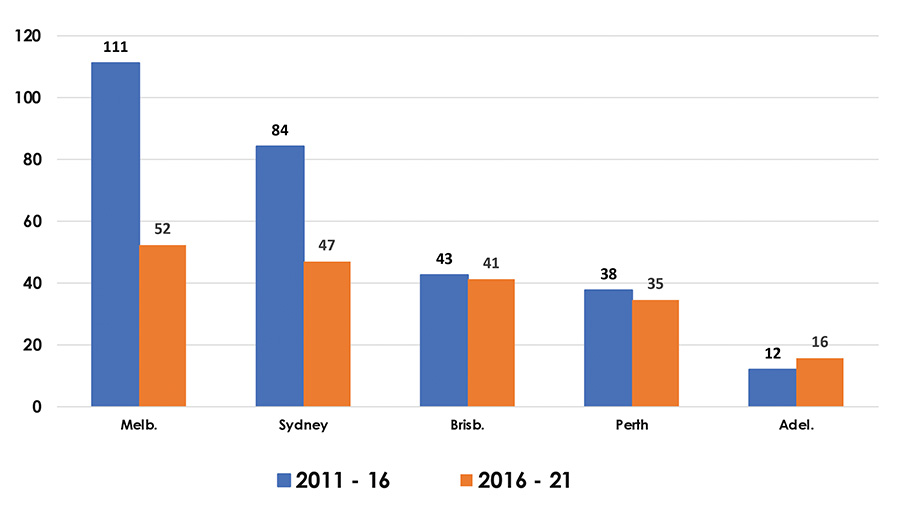
Chart 1 – Major cities: Annual population growth (000)
Chart 1 (above) shows the population growth outcomes for each of the mainland state capitals for the past two intercensal periods.
Melbourne’s average annual population increase during the 2016 – 2021 intercensal period finished up at less than half the increase the city enjoyed in the previous five-year period. Melbourne was the city most impacted directly by the halt in the national migration program and also saw a large number of residents, particularly students, move back to their country of origin. There were also elements of interstate and intrastate migration from Melbourne to Queensland and regional Victoria. Nonetheless, despite all these impacts, Melbourne still managed to record the highest average annual increase, in number terms, of each of the five mainland state capitals between 2016 and 2021.
The pattern for Sydney was broadly similar to Melbourne’s, though not quite as dramatically impacted, while the relatively positive impacts for Brisbane, Perth and, in particular, Adelaide, are evident from Chart 1. Those cities enjoyed the benefits of much shorter periods of lockdown in their respective states as well as some interstate migration away from the two larger states.
One of the interesting outcomes observed in relation to population growth at a smaller area level is that across most of the state capitals, including Sydney and Melbourne, population growth in the outer-suburban growth corridors was actually greater during the COVID period than previously expected. The population decline was concentrated largely in CBDs and inner suburbs, particularly those such as Kensington in Sydney or Carlton in Melbourne, located adjacent to large university campuses.
As mentioned above, over the past few years, we have seen many references in the press to residents of the major metropolitan areas leaving – allegedly in droves, depending on the source – for the relative utopia of regional cities and towns. The Great Resignation, a term coined in mid-2021 to describe the record numbers of people leaving their jobs following the beginning of the pandemic, is tied to this trend. But how real, or how significant, has this trend been?
The Census tells us that while there was some element of population transfer from the major state capitals to regional areas, the extent of that transfer was really quite modest. The five mainland state capitals plus Canberra accounted for 79% of the total population increase in Australia between 2011 and 2016 (pre-COVID-19) and for 67% of total population growth between 2016 and 2021. In net terms, I estimate that some 70,000 – 80,000 residents moved from the major metropolitan areas to smaller cities and towns as a result of the pandemic. While not insignificant, within the context of Australia’s national population growth typically being in the order of 350,000 in just one normal year, the seachange/treechange drift that resulted directly from the COVID-19 pandemic should not be overstated.
The extent to which that drift will continue is another question, and there are already pointers suggesting that it most likely will not. There are many (good) reasons why Australians choose to live in our state capital cities, particularly Sydney and Melbourne, and those reasons remain in place and will come back to the fore, despite having been temporarily dulled by the pandemic.
The ageing of the Australian population, and the extent to which our net migration program has enabled us over the years to slow the otherwise rapid ageing process, is another topic on which much has been written over the past few years, including in the Intergenerational Report released by the Australian Department of Treasury in June 2021.
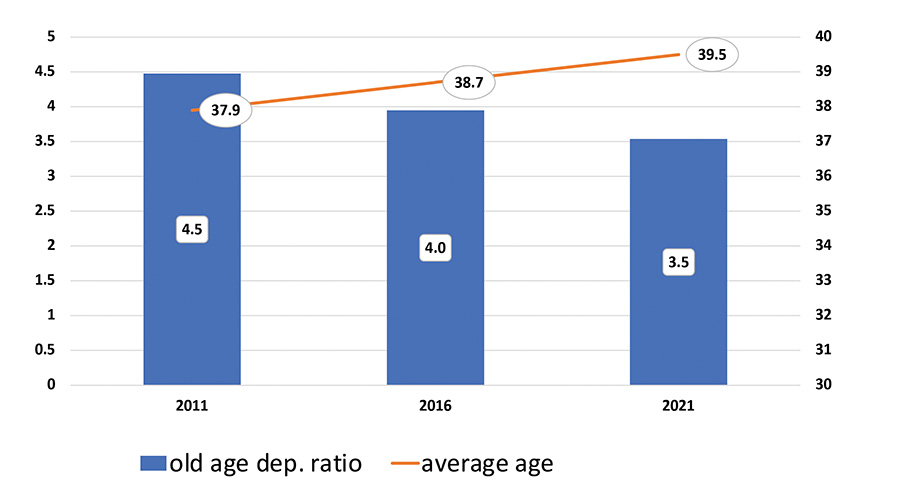
Chart 2 – Australian average age and dependency ratio
The latest Census results serve to demonstrate the truth of these concerns, as shown in chart 2 (above).
During the decade 2011 to 2021, the average age of the Australian population increased from 37.9 to 39.5, while the old age dependency ratio fell from 4.5 to 3.5.
That ratio measures the number of working age (18-65) people as compared with the number of people aged 65+. In just one decade, in part accelerated by the lack of immigration to Australia during 2020/21, the ratio has reduced rapidly, and it is on a trajectory that highlights the severe national budget implications of an ever-ageing population.
Income support for the aged is the largest component of social security spending by the Federal Government, representing over a third of budgeted payments in 2022/23 at $54.2 billion. Fortunately, since 2011, the proportion of Australians aged 65 years and over receiving the Age Pension has dropped from about 70% to about 60% in 2021. This has been due in part to a number of policy changes, including the gradual increase in the Age Pension age (increasing from 65 in 2017 to 67 by 2023) and asset test changes that commenced in 2017, and in part to increased superannuation balances.
The increasingly cosmopolitan nature of the Australian population is apparent with every Census undertaken, and 2021 was no exception. We have a very multicultural mix of residents, and the continually increasing diversity of that mix is clearly evident from Chart 3 (below).
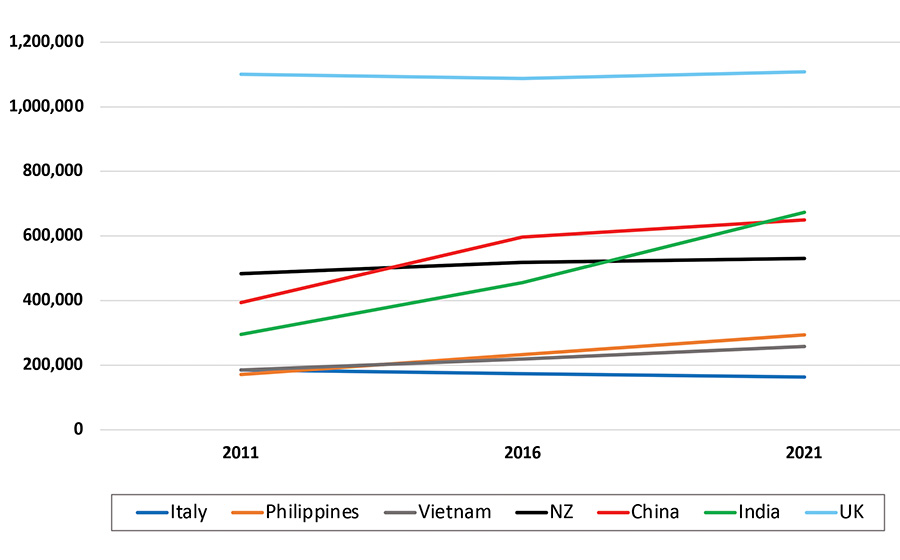
Chart 3 – Australian population born overseas: country of origin
Approximately one-third of the Australian population was born overseas. That means, of course, that the proportion of the total population with a strong connection to a country other than Australia is significantly higher once the Australian-born children of those overseas-born residents are included. The first wave of substantial levels of immigration to Australia, following World War II, was almost exclusively from Europe, in particular from the UK and Mediterranean countries, including Italy and Greece. Those migrants, and their descendants, have left their imprints on the Australian tapestry in many ways but are now relatively insignificant, at least in number terms, within the total population.
During the past decade, the focus has increasingly been on Asia and India, with about two million Australian residents at 2021 having been born in Asia and a further 673,000 born in India. Between them, Asian and Indian born residents now account for more than 10% of the national population.
What is also readily apparent from the above chart is the increasing importance, particularly of Indian-born residents. At the 2011 Census, there were 295,000 Australian residents who had been born in India, with this number jumping to 455,000 by the 2016 Census and then increasing to 673,000 at the 2021 Census. After the United Kingdom, the Indian-born population is now Australia’s second-largest migrant community.
The number of Australian residents born in China at 2021, by comparison, was 650,000 (including those born in Hong Kong), although large numbers of residents were also born in other Asian countries, including the Philippines, Vietnam, Malaysia, Sri Lanka, South Korea, Indonesia and Thailand.
From a retail perspective, the shopping behaviours of people born from these various countries differ substantially, so location intelligence on the distribution of each group (for example, where they live within each city) is readily available and able to be incorporated into any retailer’s or shopping centre’s strategy.
Post the Census and post COVID-19, what can we now expect to see?
As consequential as the impacts of COVID-19 have been for the retail sector in Australia, the reality is that total retail expenditure and the key drivers of it, remain relatively intact. However, the distribution of retail expenditure by category changed dramatically, as has the spatial distribution, creating a situation of some big winners and big losers, by category and by location.
Looking forward, the Department of Home Affairs has already released its intentions to bring 160,000 new migrants into Australia in 2022/23, comprising 110,000 skilled employees across various categories and 50,000 under the Family Migration program, enabling Australians to reunite with family members from overseas and provide them with pathways to citizenship. This total does not include students, of which about 70% have already returned, with student numbers comparable to pre-COVID-19 levels expected to be achieved again in approximately two years’ time.
It remains highly likely, in my view, that net migration numbers post 2022/23 will be even higher, potentially, together with the return of students, leading to a higher total net migration program than existed pre-COVID-19, at least temporarily. Within this context, I expect that Indian migration will continue to play an ever more significant role within the total Australian migration program.
The upshot is that most of the damage wrought by the COVID-19 pandemic on the retail sector broadly has been rectified, noting that for many retail categories, the pandemic resulted in growth rather than decline. Yes, the drift to online purchasing has increased enormously, but it has been existing bricks-and-mortar retailers that gained most of that benefit and, in any case, even over the past two years, there has also been some modest growth in in-store sales for many categories. CBD retailing is another matter, dependent on the return of at least the great majority of CBD workers as well as overseas students, both likely to take a few more years.


