What defines a ‘regional shopping centre’? It used to be that they had a department store as a tenant; simple as that. Today, it’s not that simple; department stores are reducing their GLA, some even closing stores and that has little effect on the ‘regional’. In this exclusive article published in the latest issue of SCN magazine, Ian Shimmin and Hamish Coleman from Urbis discuss the evolution of regional centres…

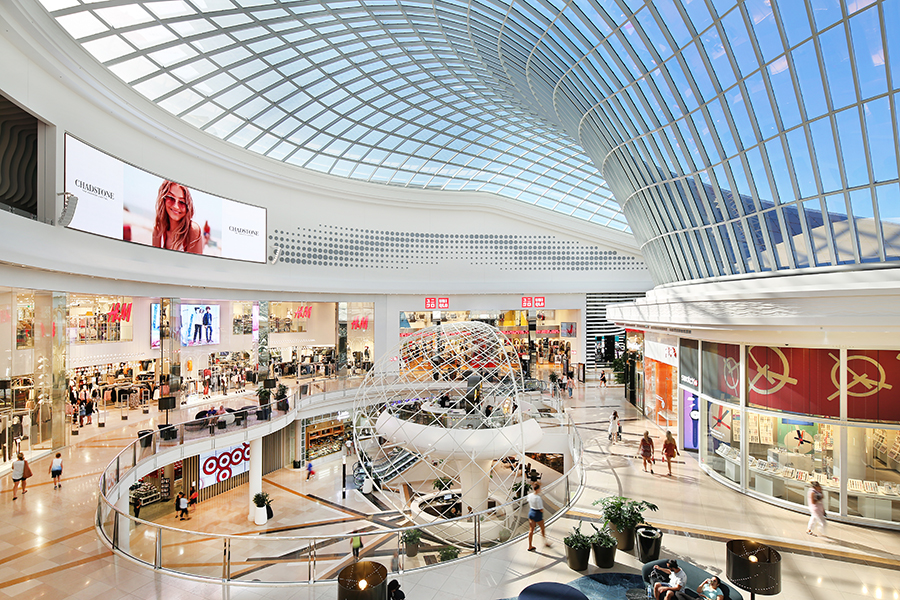
In the neon-lit 1980s, when Big Guns legend, Chadstone, was located in Melbourne’s outer suburbs and anything with shoulder pads was flying off the shelves, a shopping centre playing a ‘regional role’ meant one thing (or at least one thing) – having a department store. But times have changed. The relative decline of department stores is not new.
Indeed, the industry has debated, often endlessly, the impact of their reduced role for many years. The Urbis Shopping Centre Benchmarks can, however, demonstrate the effect department store rationalisation is having on regional shopping centre composition taking a broad perspective and using real data.
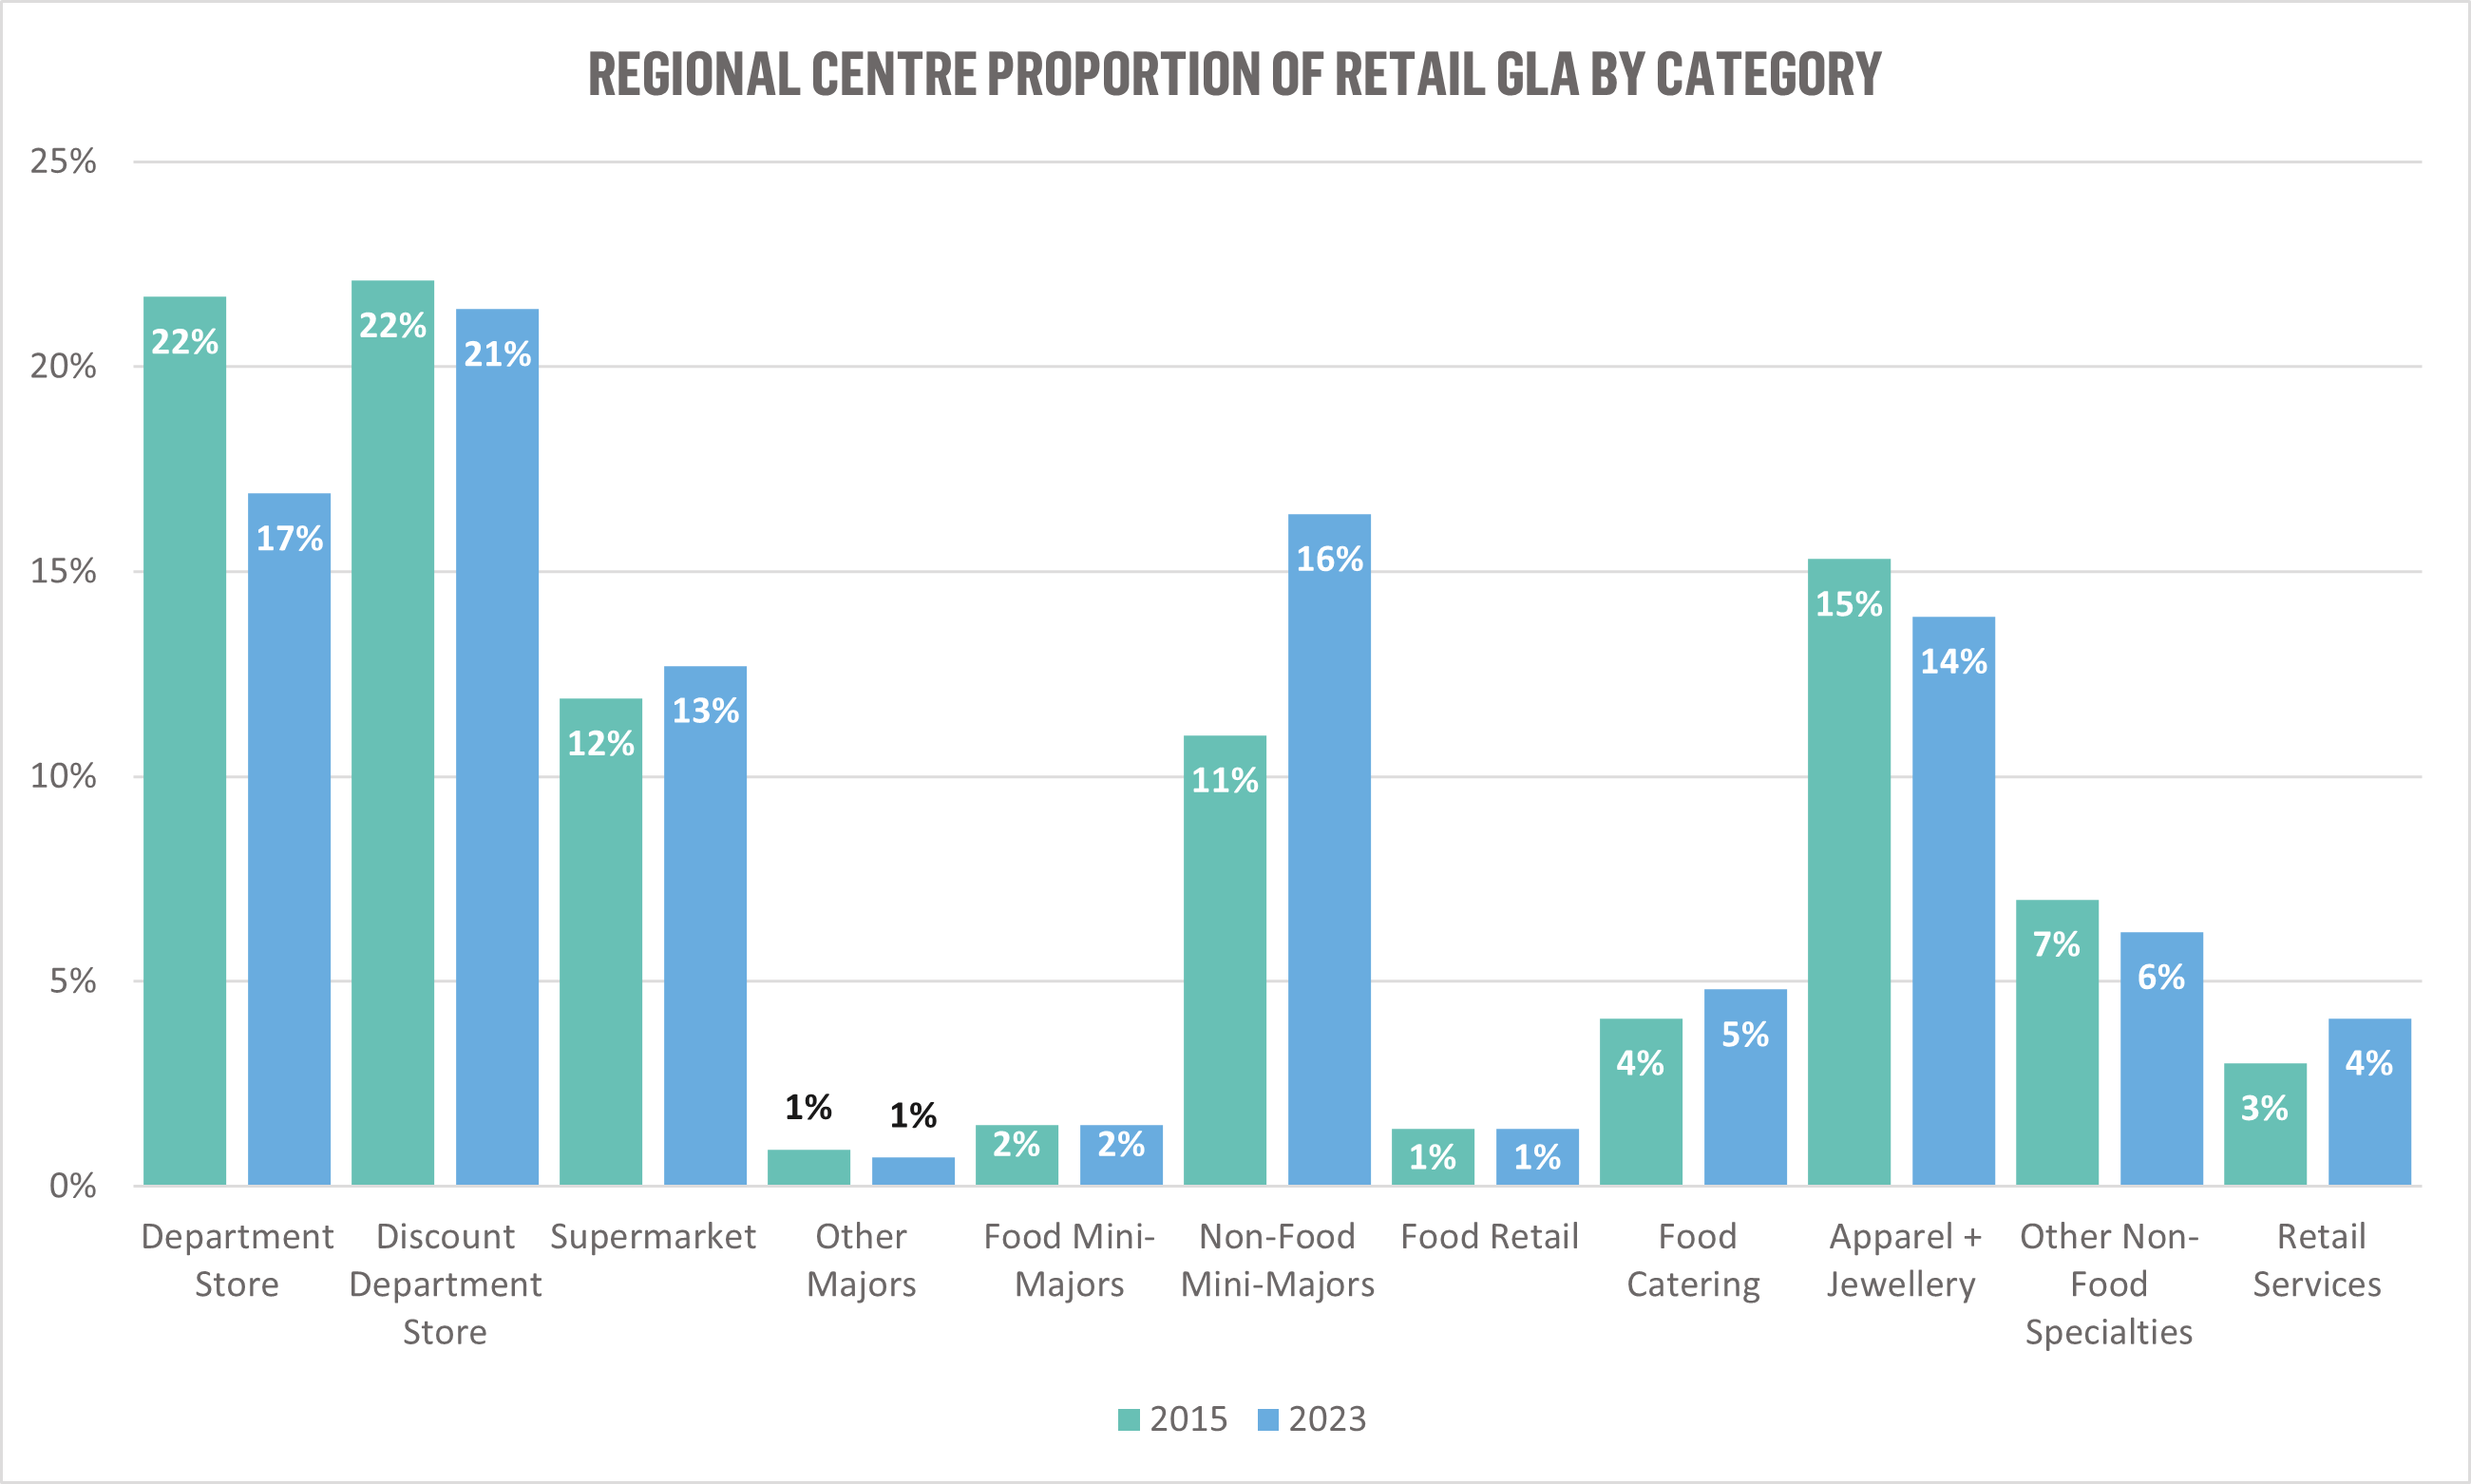
Between 2015 and 2023, department store GLA as a proportion of total regional centre area fell from nearly 22% to just below 17%, from an average of 14,300m2 to 11,900m2, a drop of about 17%. Obviously, at the individual level, many centres have experienced 100% falls in department store GLA (the decrease in area overall is relatively evenly split between downsizing and exiting centres entirely).
How have landlords filled these department store-sized holes in their floorplan? Almost exclusively by back-filling non-food mini-majors. This category has increased its share of GLA from 11% to more than 16%, nearly on par with department stores. It is important to note that declines in department store GLA have not resulted in falls in overall retail floorspace; in fact, regional centres have grown in size by about 6%.
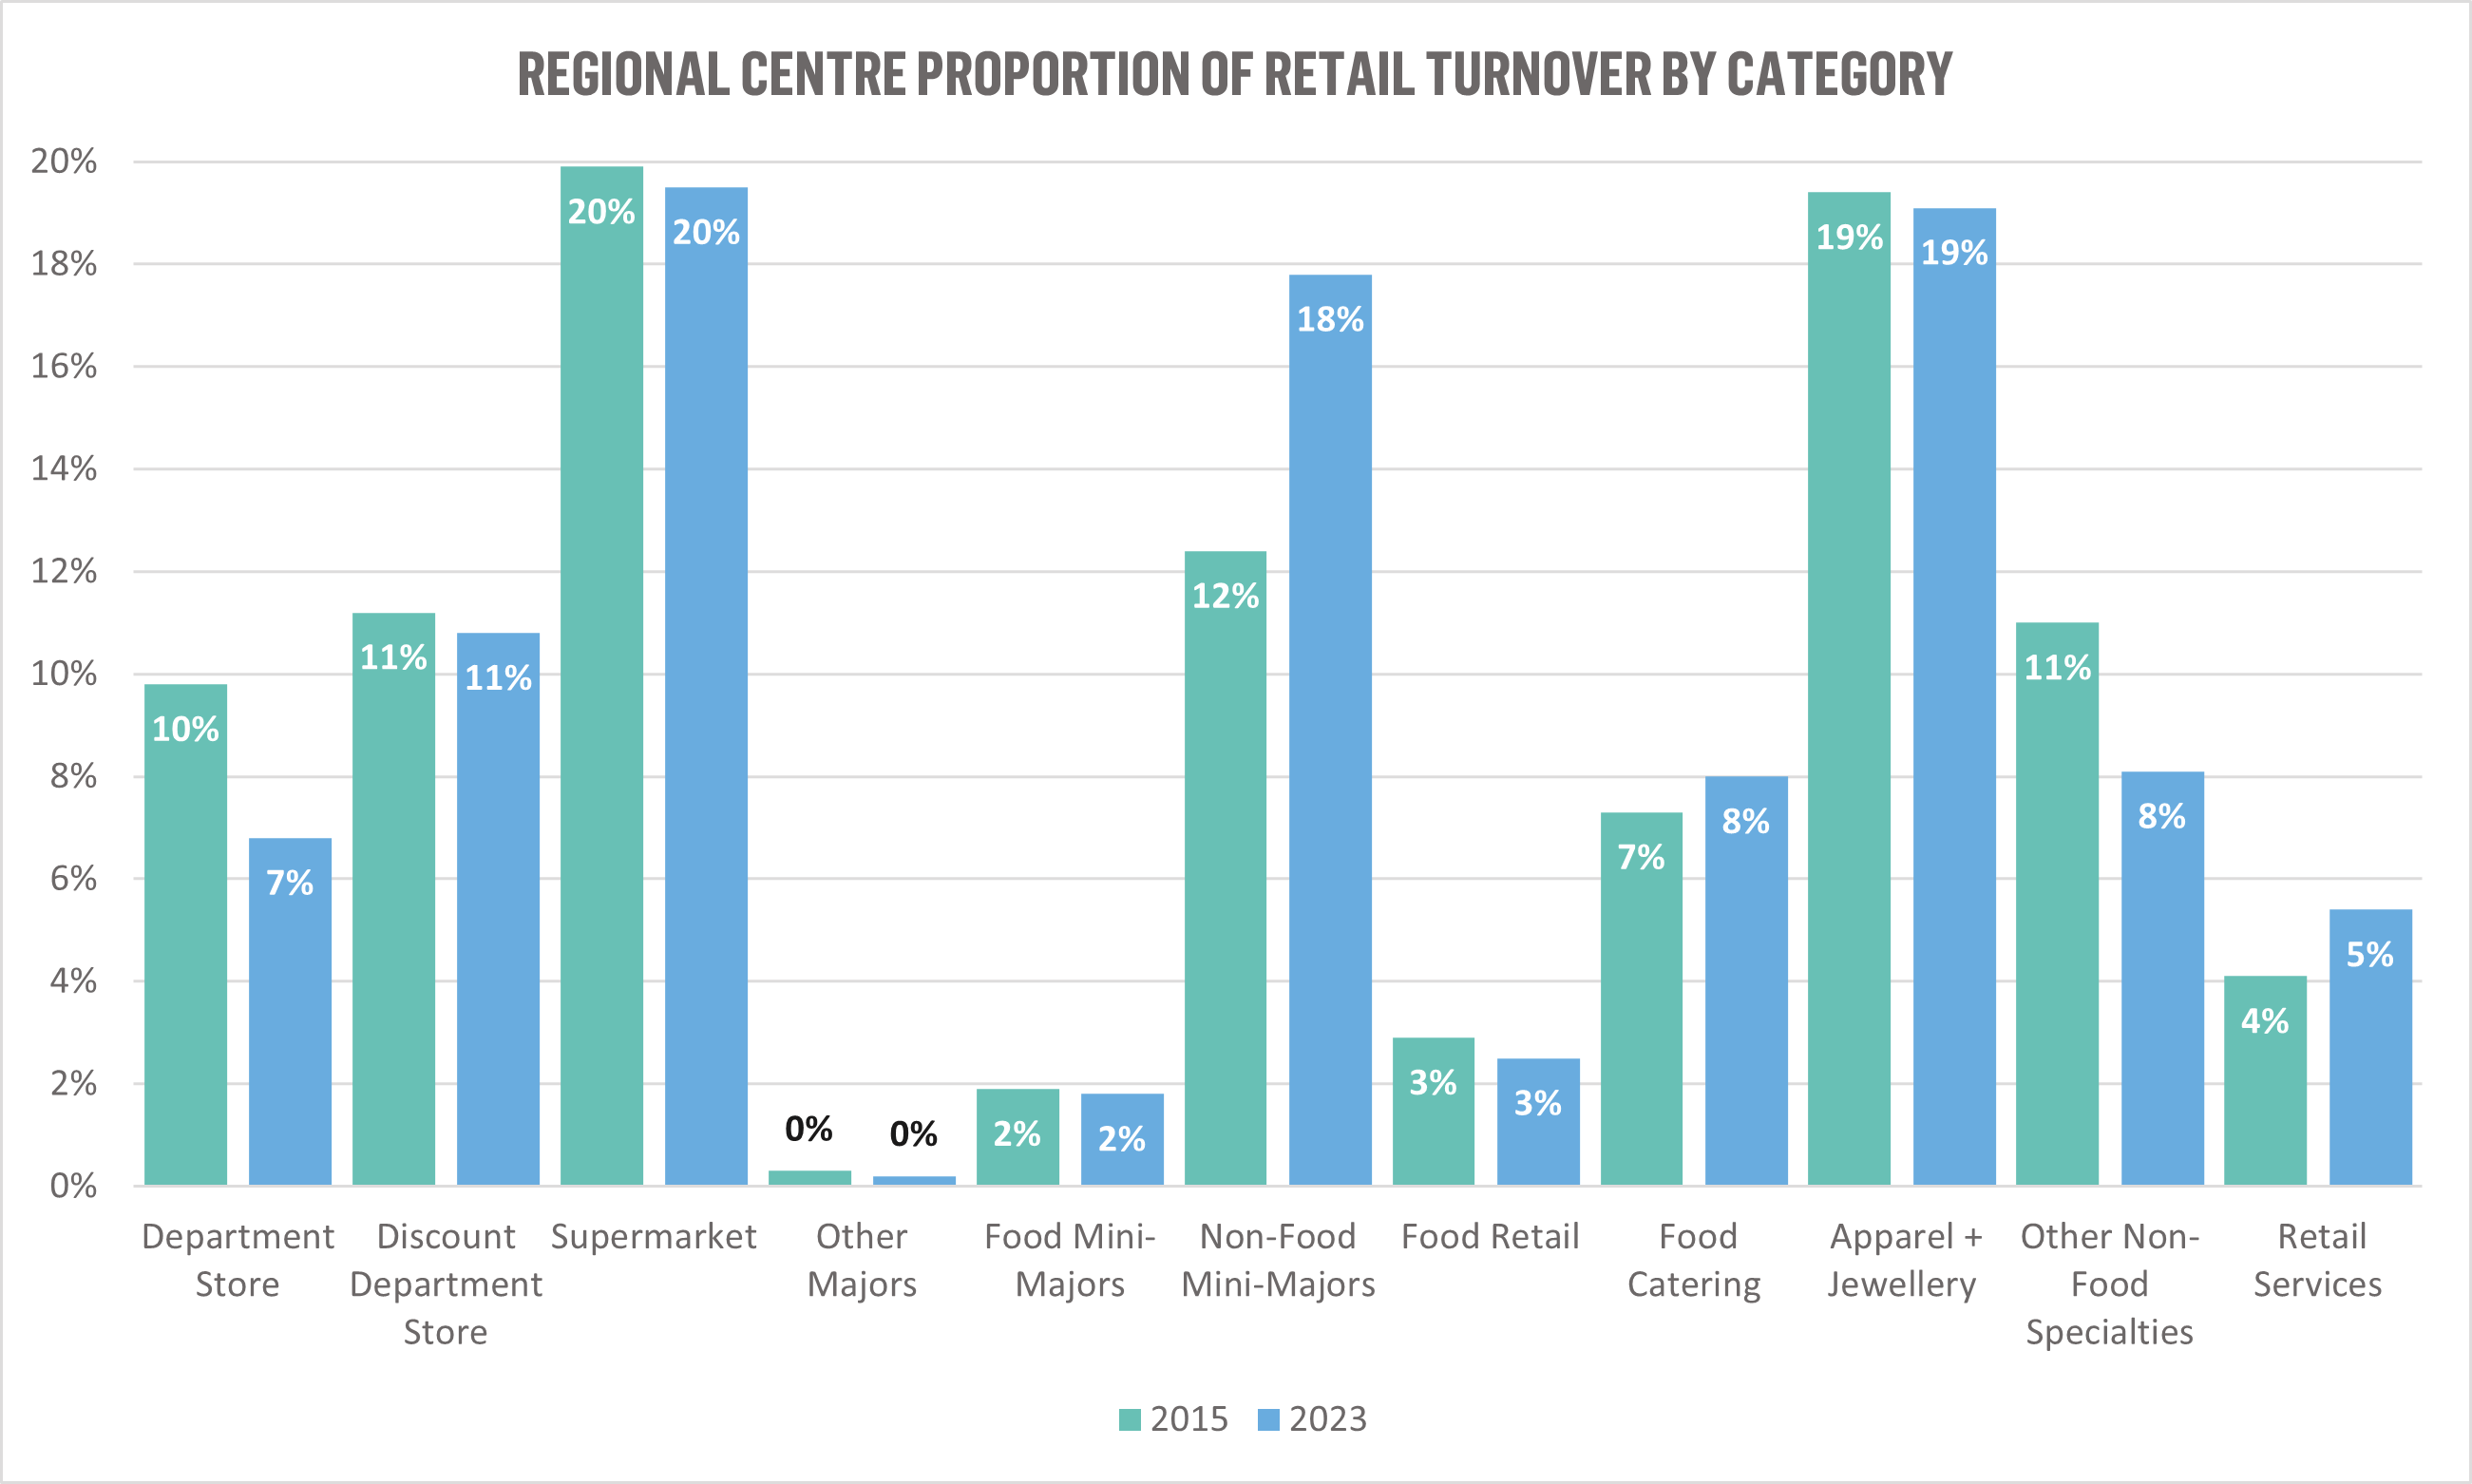
Moving Annual Turnover (MAT) figures paint an even clearer picture. In 2015, department stores still made up 10% of regional centre turnover, just behind non-food mini-majors, at 12% (both still well below supermarkets and apparel/jewellery at 20% and 19%, respectively). By 2023, department store contribution to total turnover had fallen to less than 7%, with non-food mini-majors climbing to 18%.
Only four categories now contribute less to regional centre turnover than department stores.
Can a category that makes up less than one-fifth of GLA and well-under 10% of turnover really be considered an essential component of a regional centre? At Urbis, we don’t think so.
Indeed, this is a decision which has been some time in the making. We have been debating the relevance of department stores to centre classifications for some time and actively considering whether to adjust our definition of regional shopping centres.
The disruption of COVID and its potential long-term impacts gave cause for delay, but the time is right to evolve our regional centre definition in line with the changes we track each year in the Urbis Shopping Centre Benchmarks data.
The definition of regional centres needs to change in line with the centres themselves
The time is right to change the definition of a regional centre. But that is the easy part. If a department store is no longer the key ingredient, or a defining characteristic of a centre playing a ‘regional role’, what is? Debate in the Urbis offices came down to one thing: sales. The extent to which consumers vote with their wallet to spend at a centre is surely the best measure to understand the role it is playing in its market. Scale remains important, but exactly what accounts for this scale (excluding supermarkets/food retail) is somewhat irrelevant.
So, what makes a centre a regional centre in 2023?
There are two key criteria:
- Centre GLA over 50,000m2
- $200m+ MAT in reported non-food categories (including entertainment).
This does change the classification of a number of centres. However, we believe this new definition more accurately reflects a centre’s contribution to its local retail market. Of course, this definition will likely also evolve alongside shopping centres themselves.
Urbis was not alone in considering these issues. Cistri, Urbis’s international business, faced similar questions when developing the Asia-Pacific Shopping Centre Classifications with the International Council of Shopping Centers (ICSC).
Regional centres are increasingly not just about shopping
The retail composition of regional centres has clearly evolved in recent years, but it’s not just in the retail space where change is evident. Regional centres are increasingly becoming hubs for work, medical and health/fitness services, as well as child-minding. Such non-traditional uses have grown from 4.5% of the total centre area to 6.1% between 2015 and 2023. GLA has increased from 3,500m2 to 5,400m2 – a growth of more than 50%. Commercial office space became the largest single non-traditional use in 2023, accounting for 2.3% of the total regional centre footprint. It could be said that regional centres in 2023 are starting to embrace the vision of an integrated community space, which Victor Gruen, the father of shopping centres, had for them all those years ago.
The retail role of regional centres has never been clearer
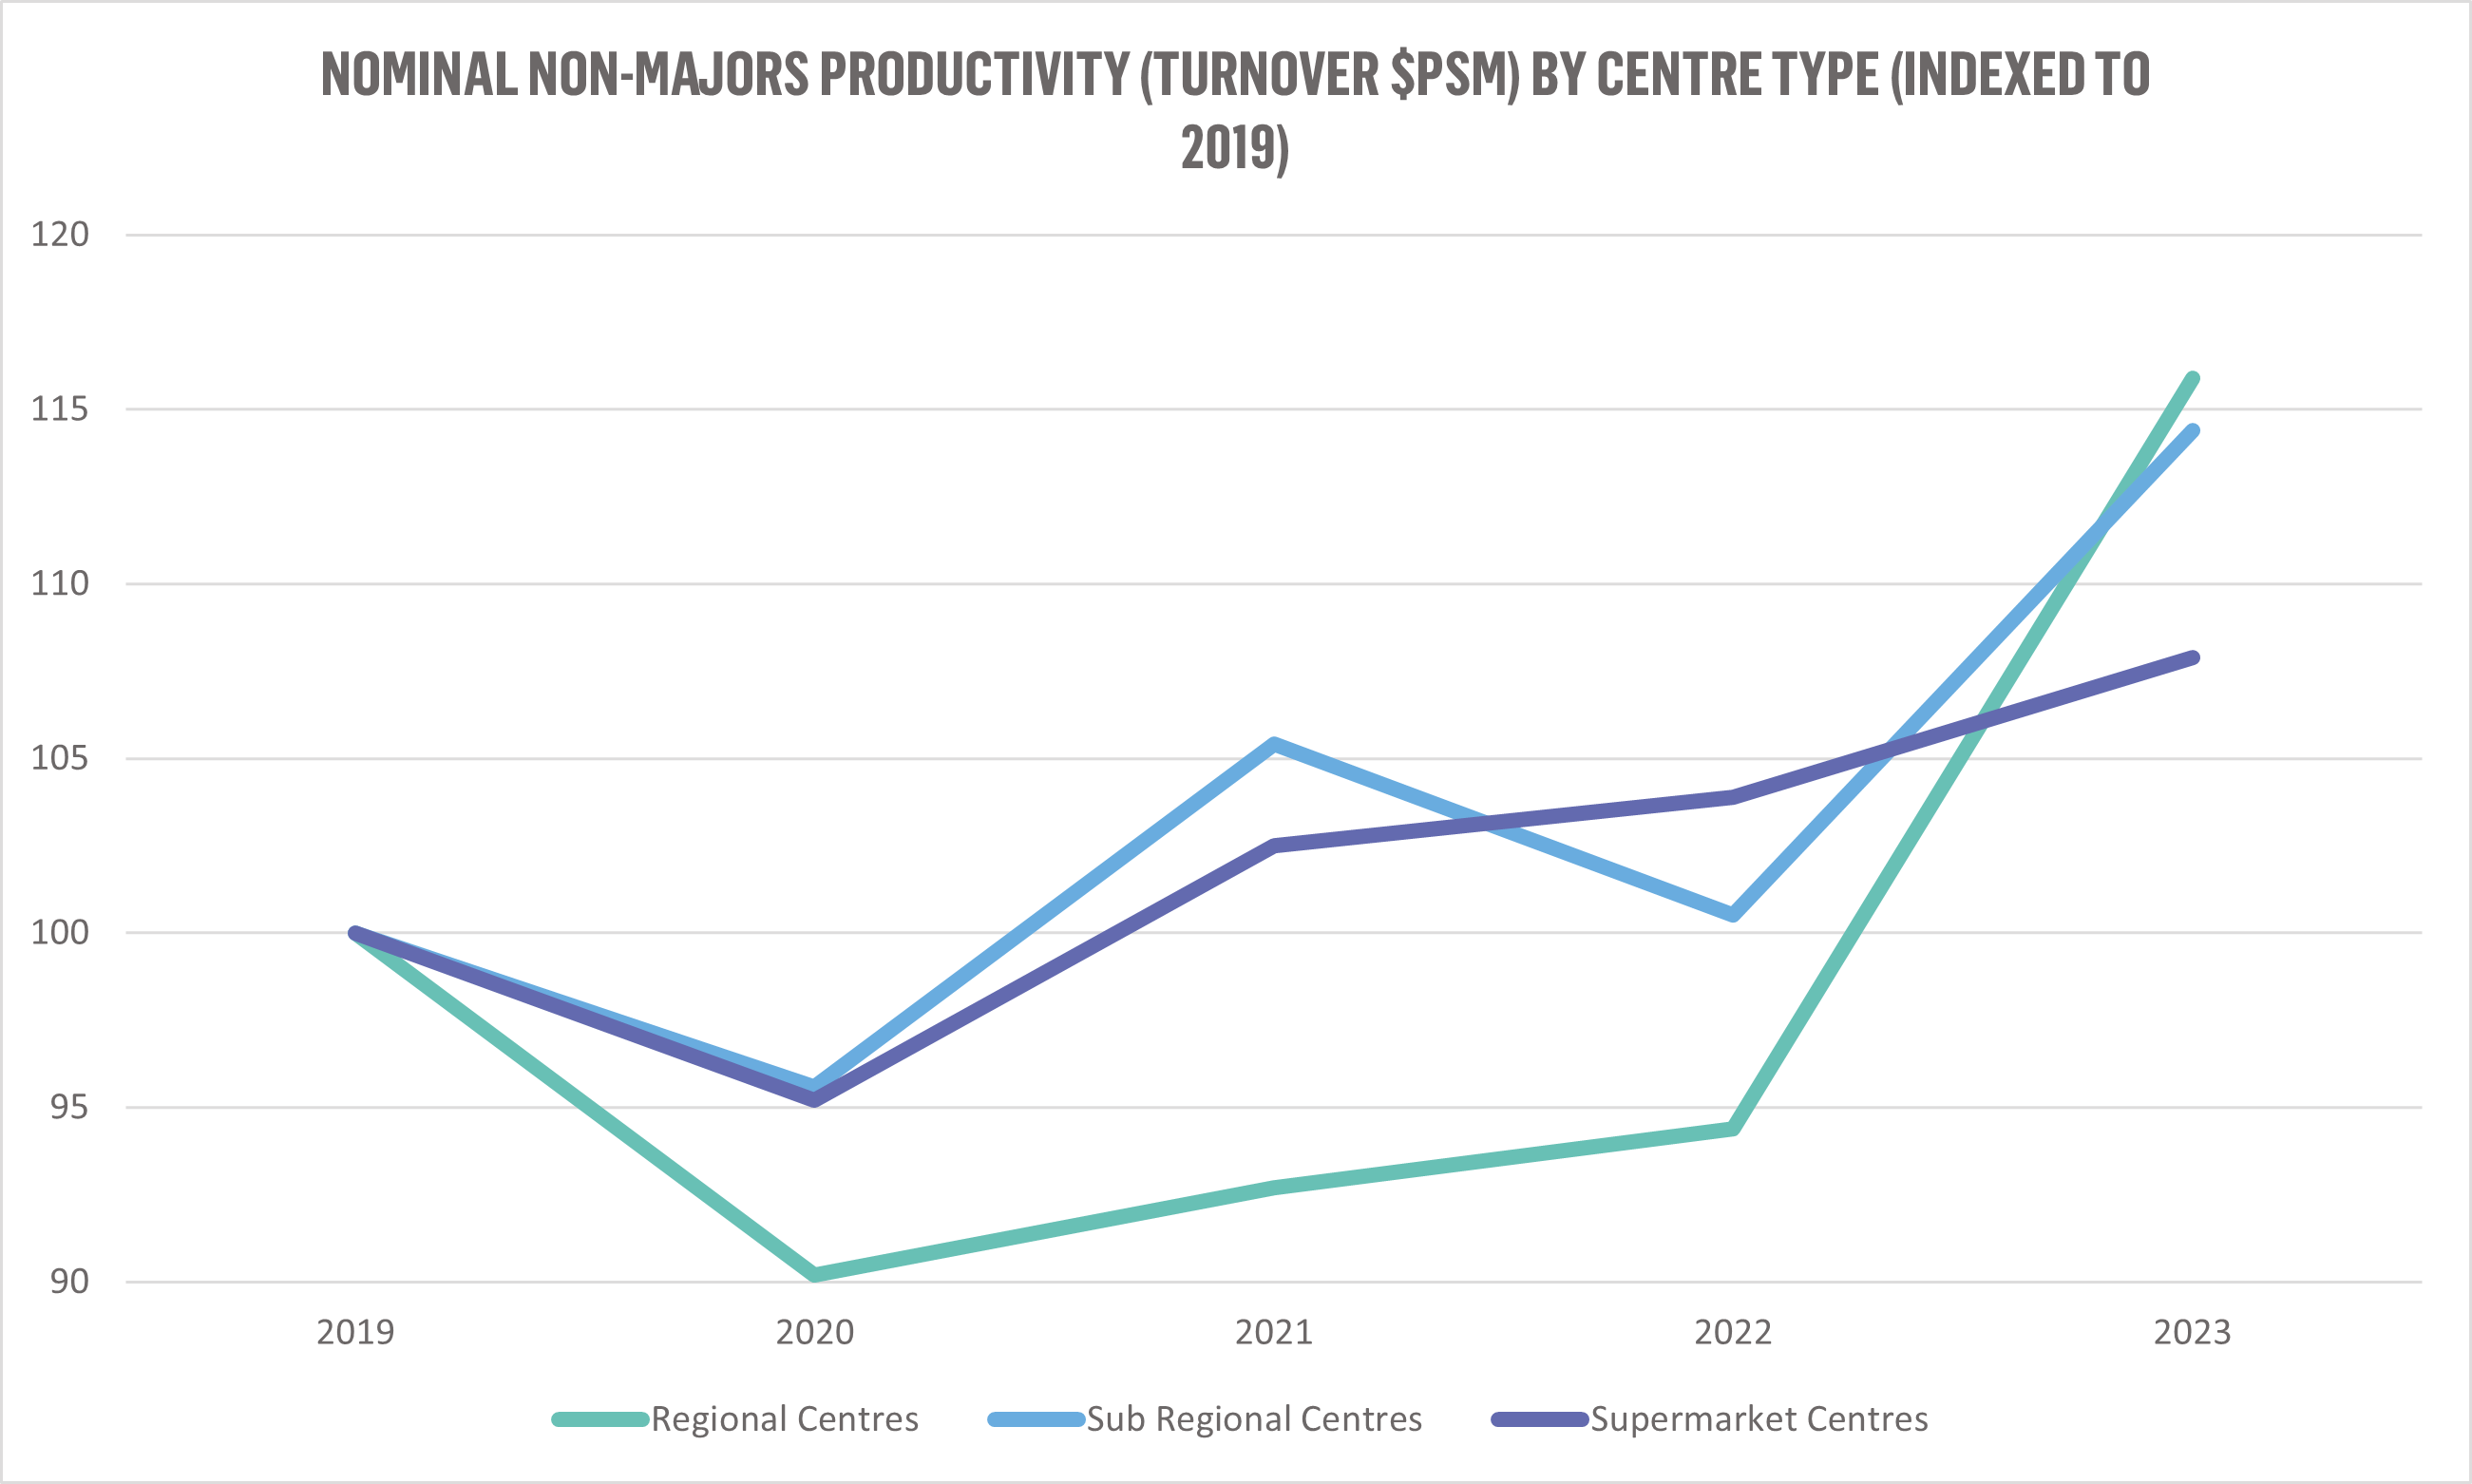
The definition of regional centres may have changed, and they may have increasingly adopted a much broader function, but their fundamental retail role remains the same. In fact, 2023 was the year regional centres recovered from their COVID-induced hangover, reaffirming their pre-eminent position in the retail property landscape. Using 2019 as a pre-COVID reference year, in 2022, regional centre non-majors’ productivity remained 5% below where it was before the pandemic, lagging sub-regionals (1% above 2019 levels) and supermarket centres (4% above). In 2023, regionals roared back. Productivity now sits 16% above 2019 levels, overtaking sub-regionals (14%) and supermarket centres (8%).
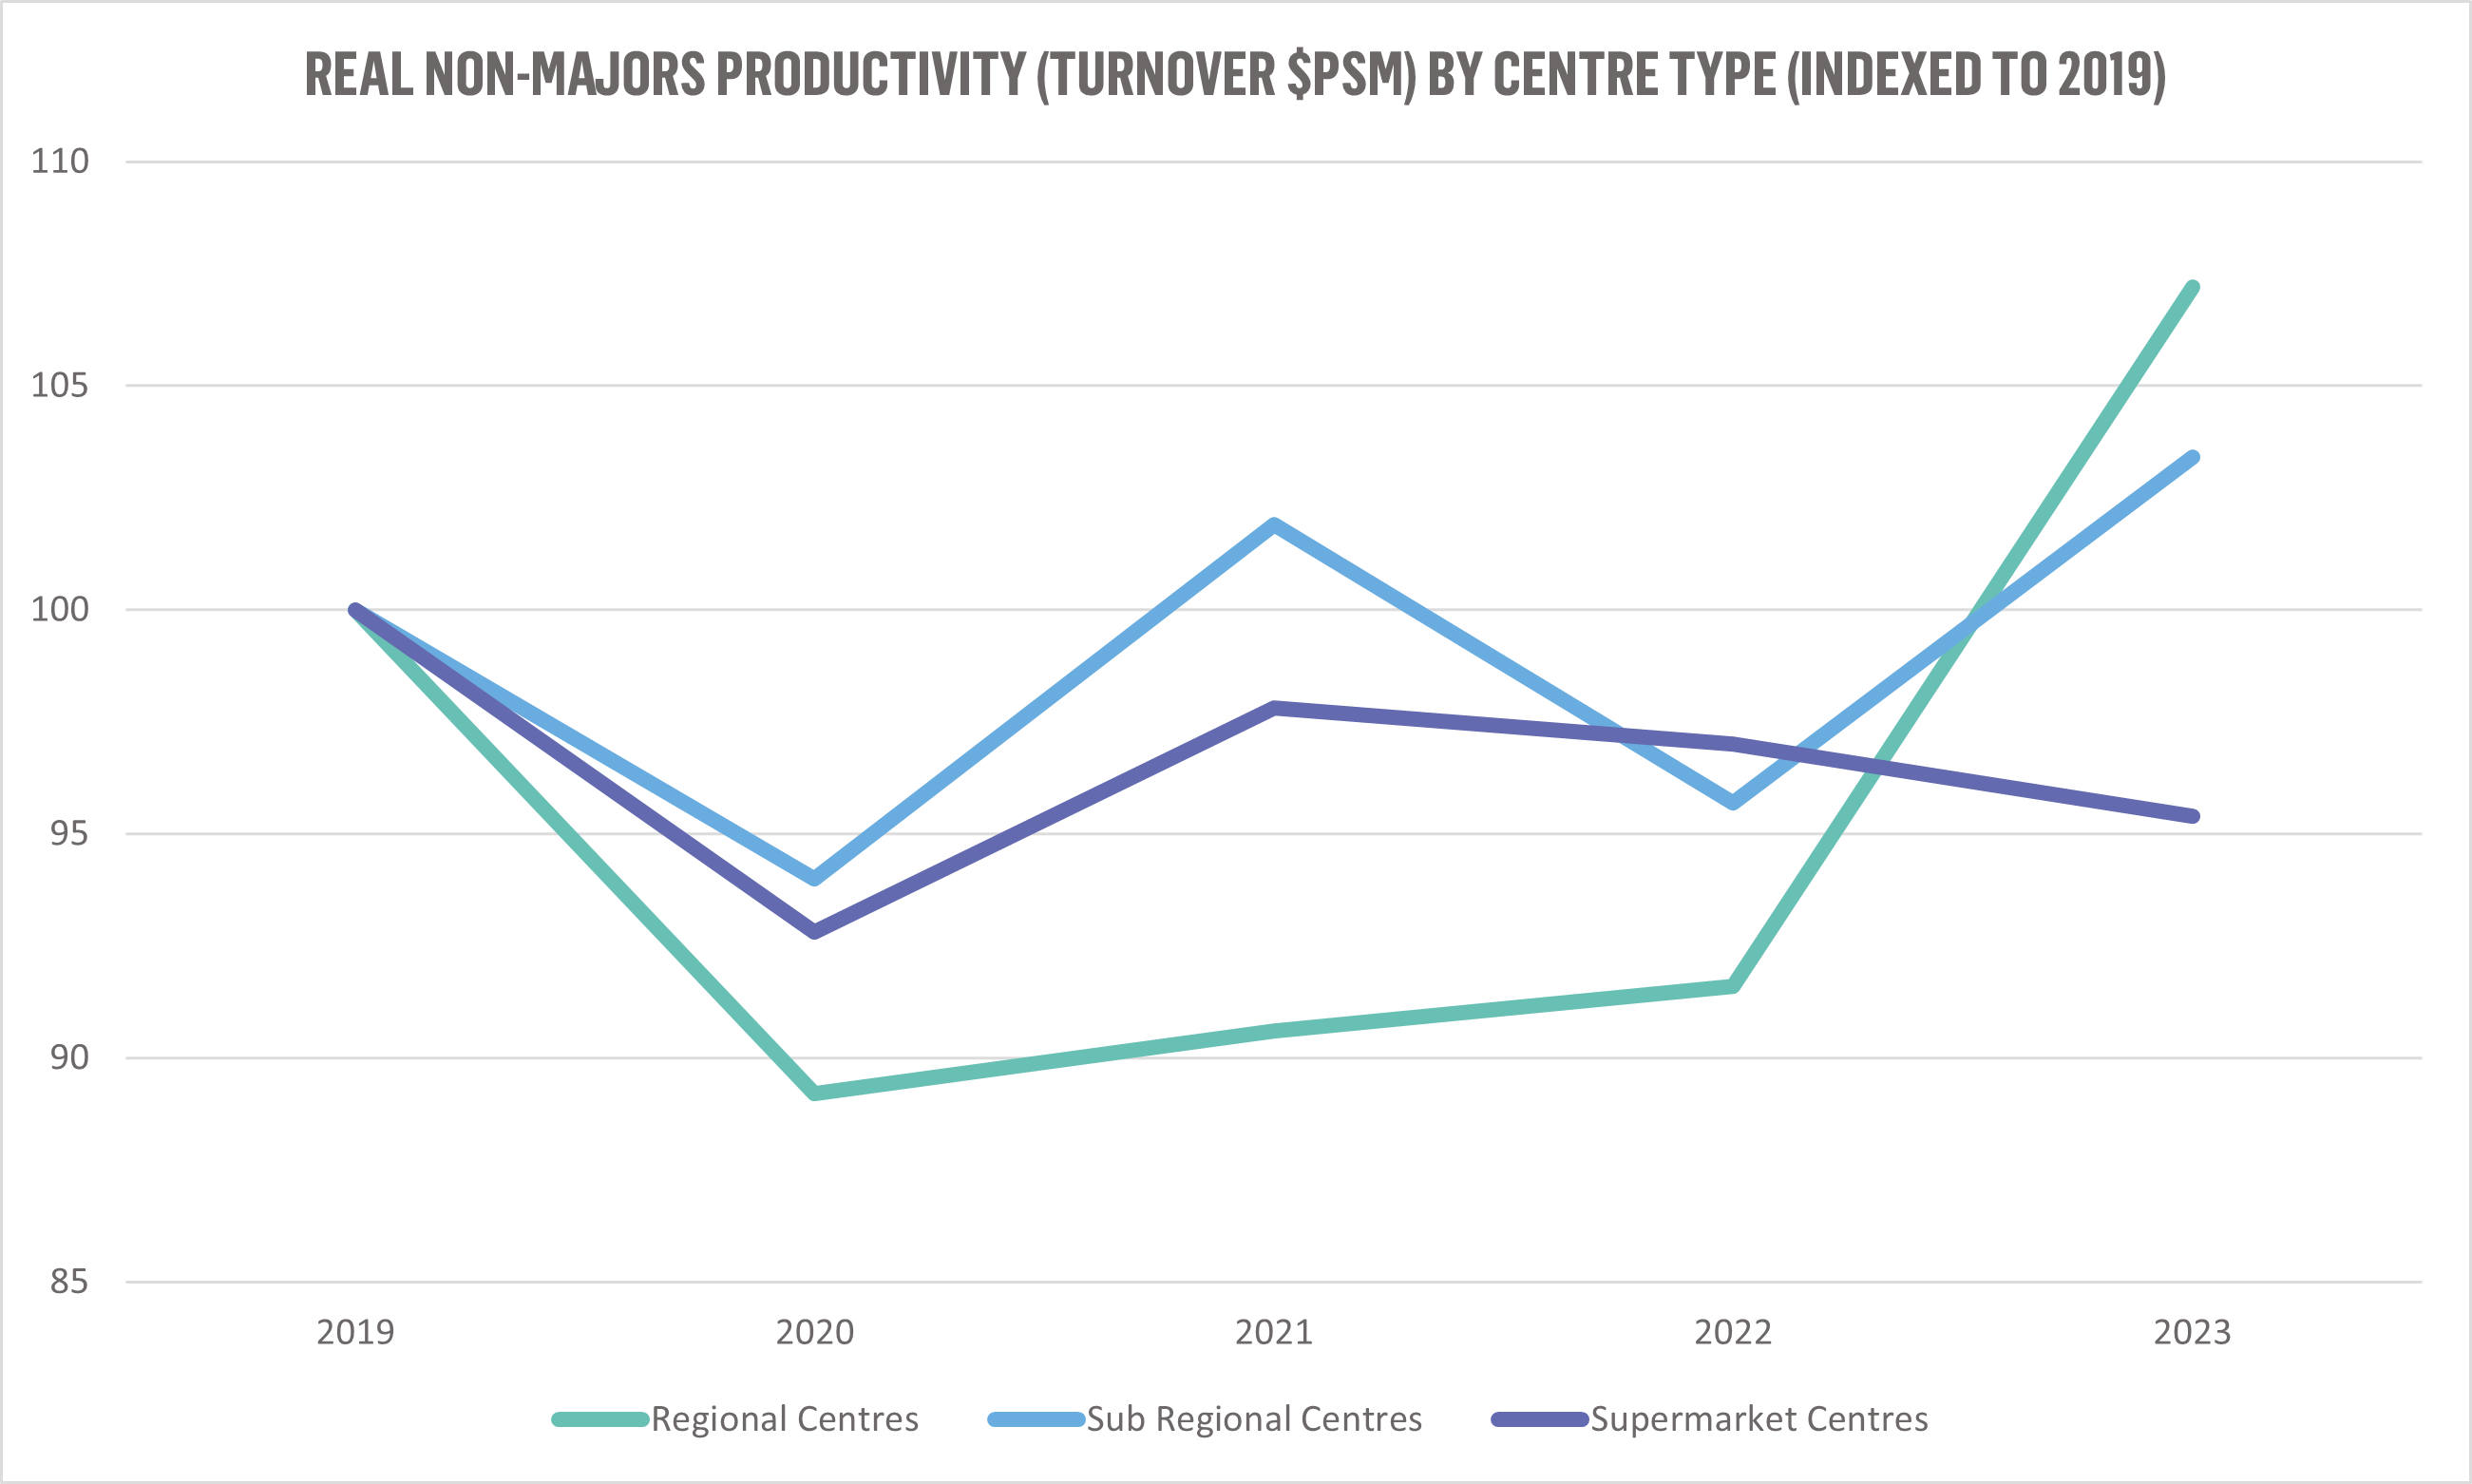
This 2023 rebound is even more pronounced in real terms – taking into account the differences in inflation for different retail categories.
Based on this measure, regional centres are 7% more productive than they were in 2019, while sub-regional centres are 3% more productive and supermarket centres 6% less. In 2022, regional centres were still 8% below 2019 levels in real turnover productivity, meaning 2023 saw a swing of a full 15%! 2023 is the year regional centres got their mojo back.
Of course, whether this renaissance continues requires an article all to itself. Certainly, the six months since the release of the Urbis Shopping Centre Benchmarks have seen retail trade soften overall. Urbis’s Retail Expenditure and Macroeconomic Outlook forecast is generally positive for retail trade in the medium term, but we live in interesting economic times, and there are a multitude of factors to consider.
Clawing back rents is a key challenge for regional centre landlords
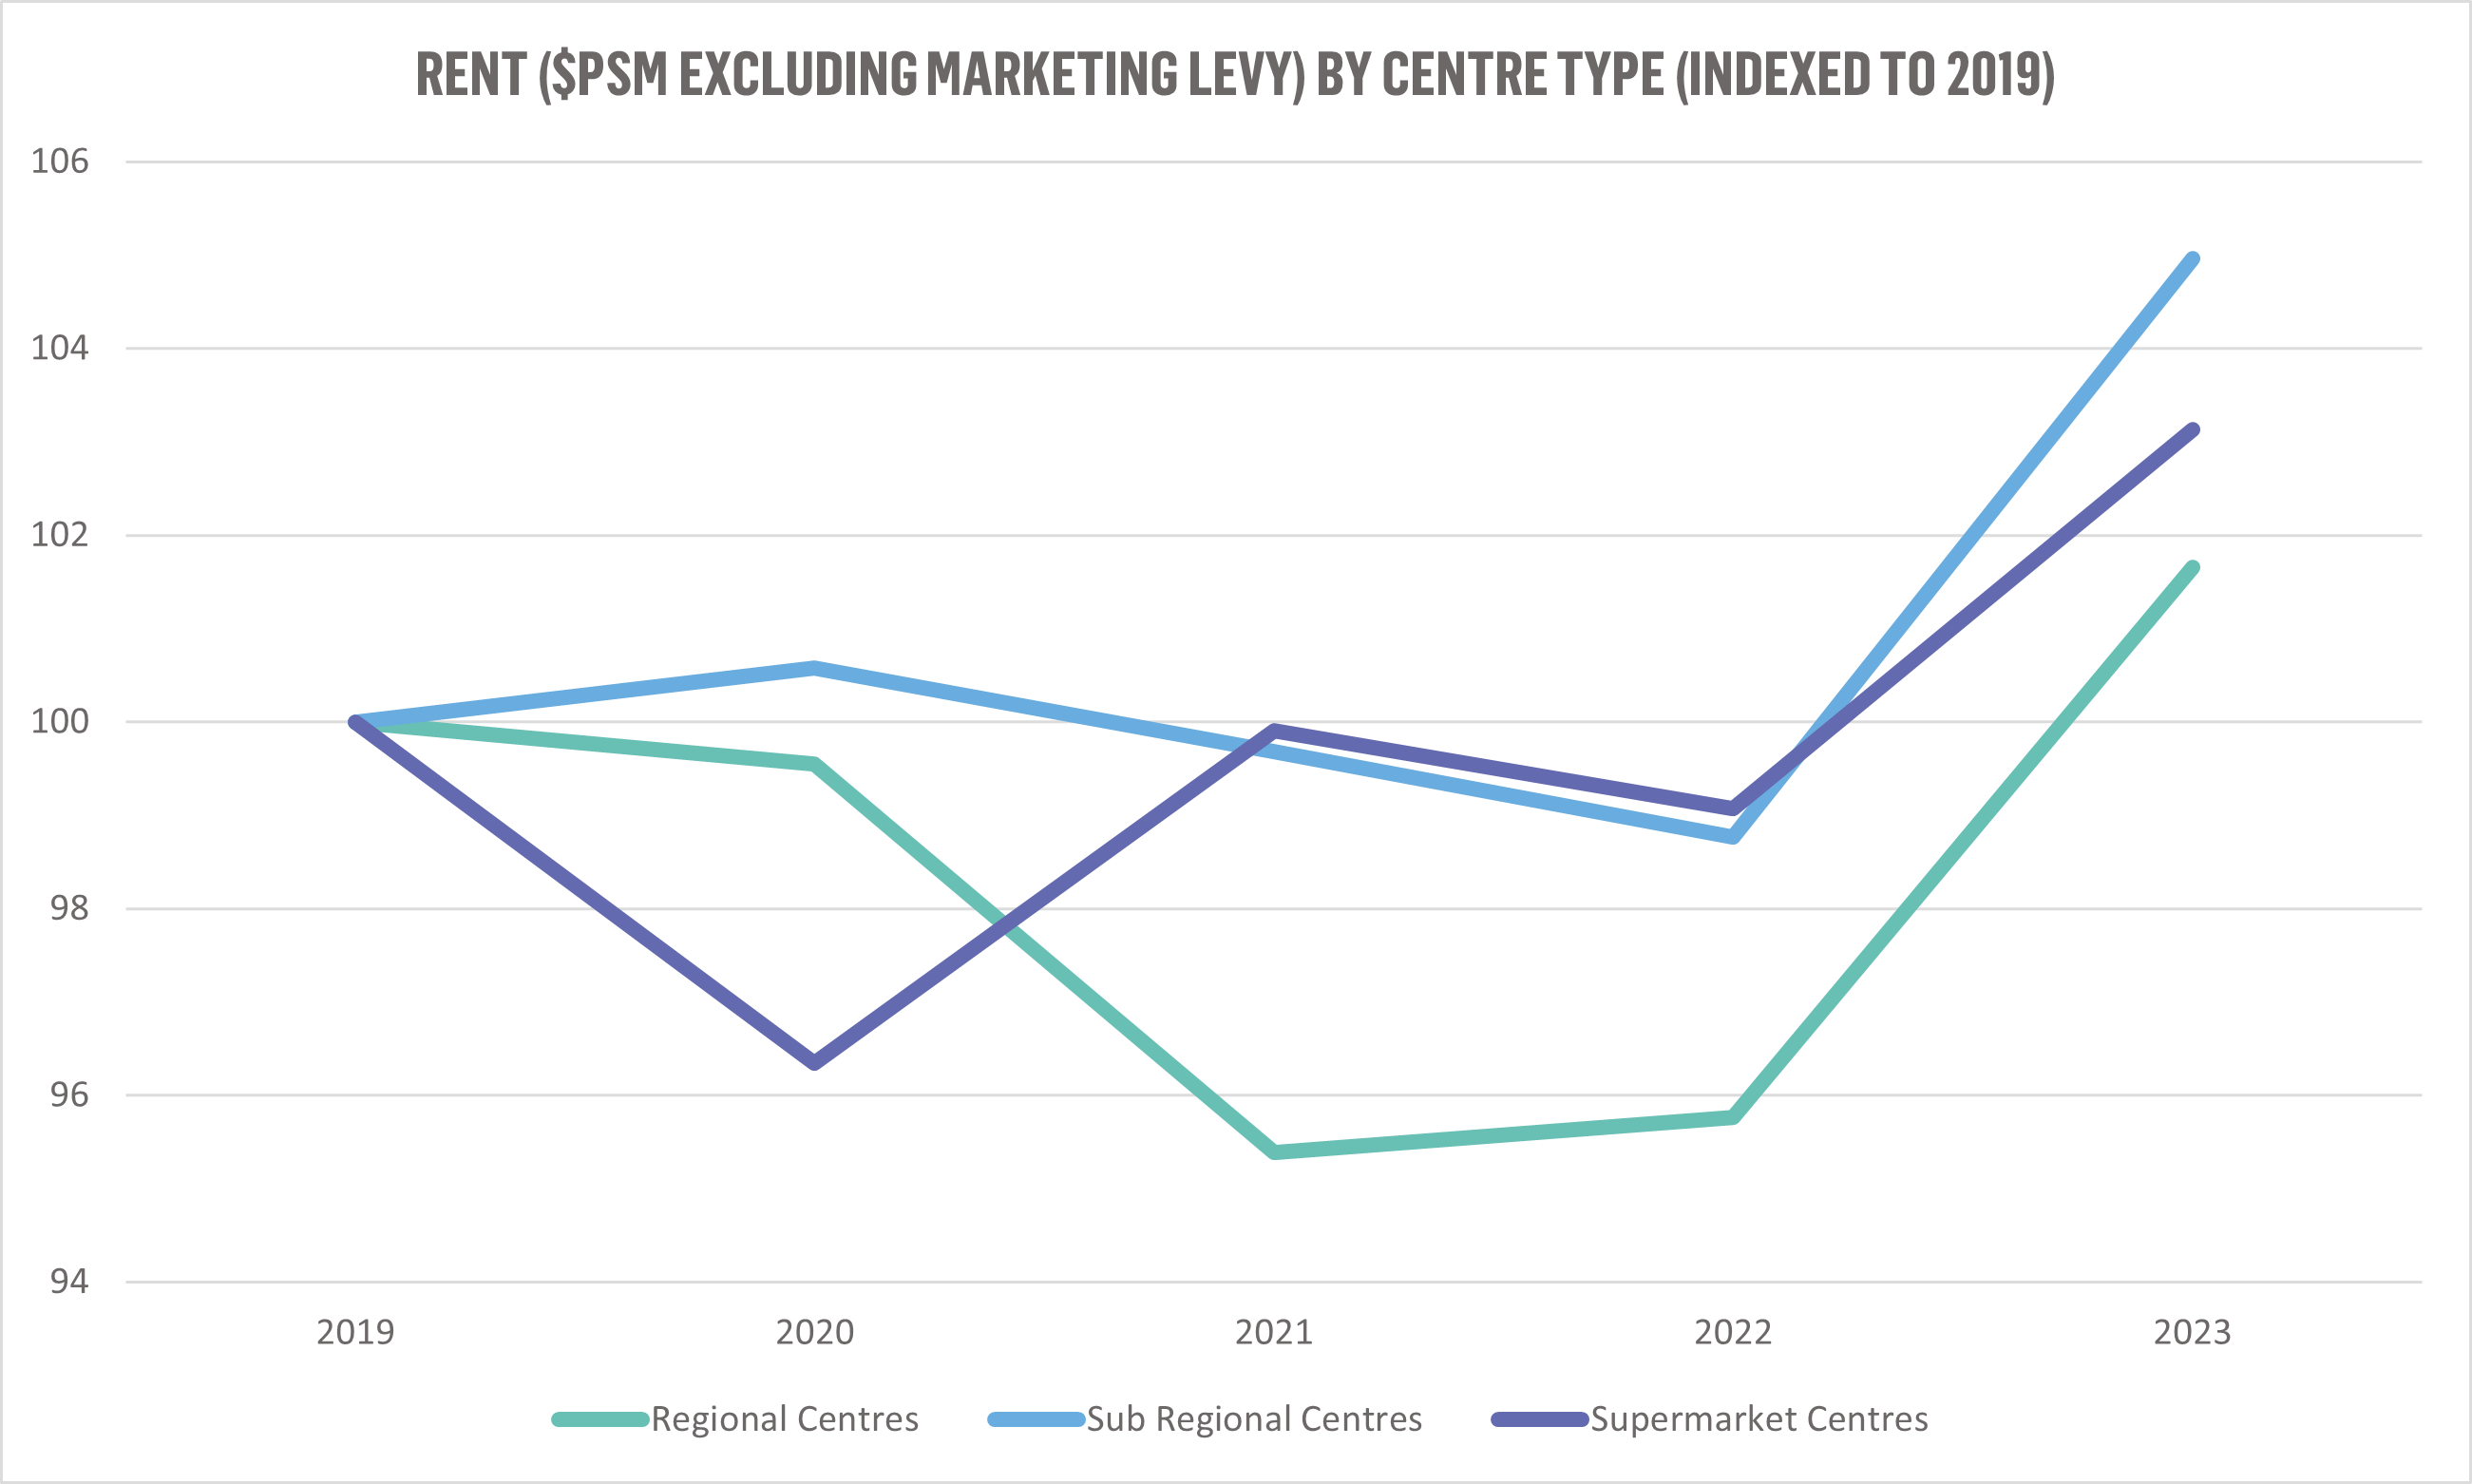
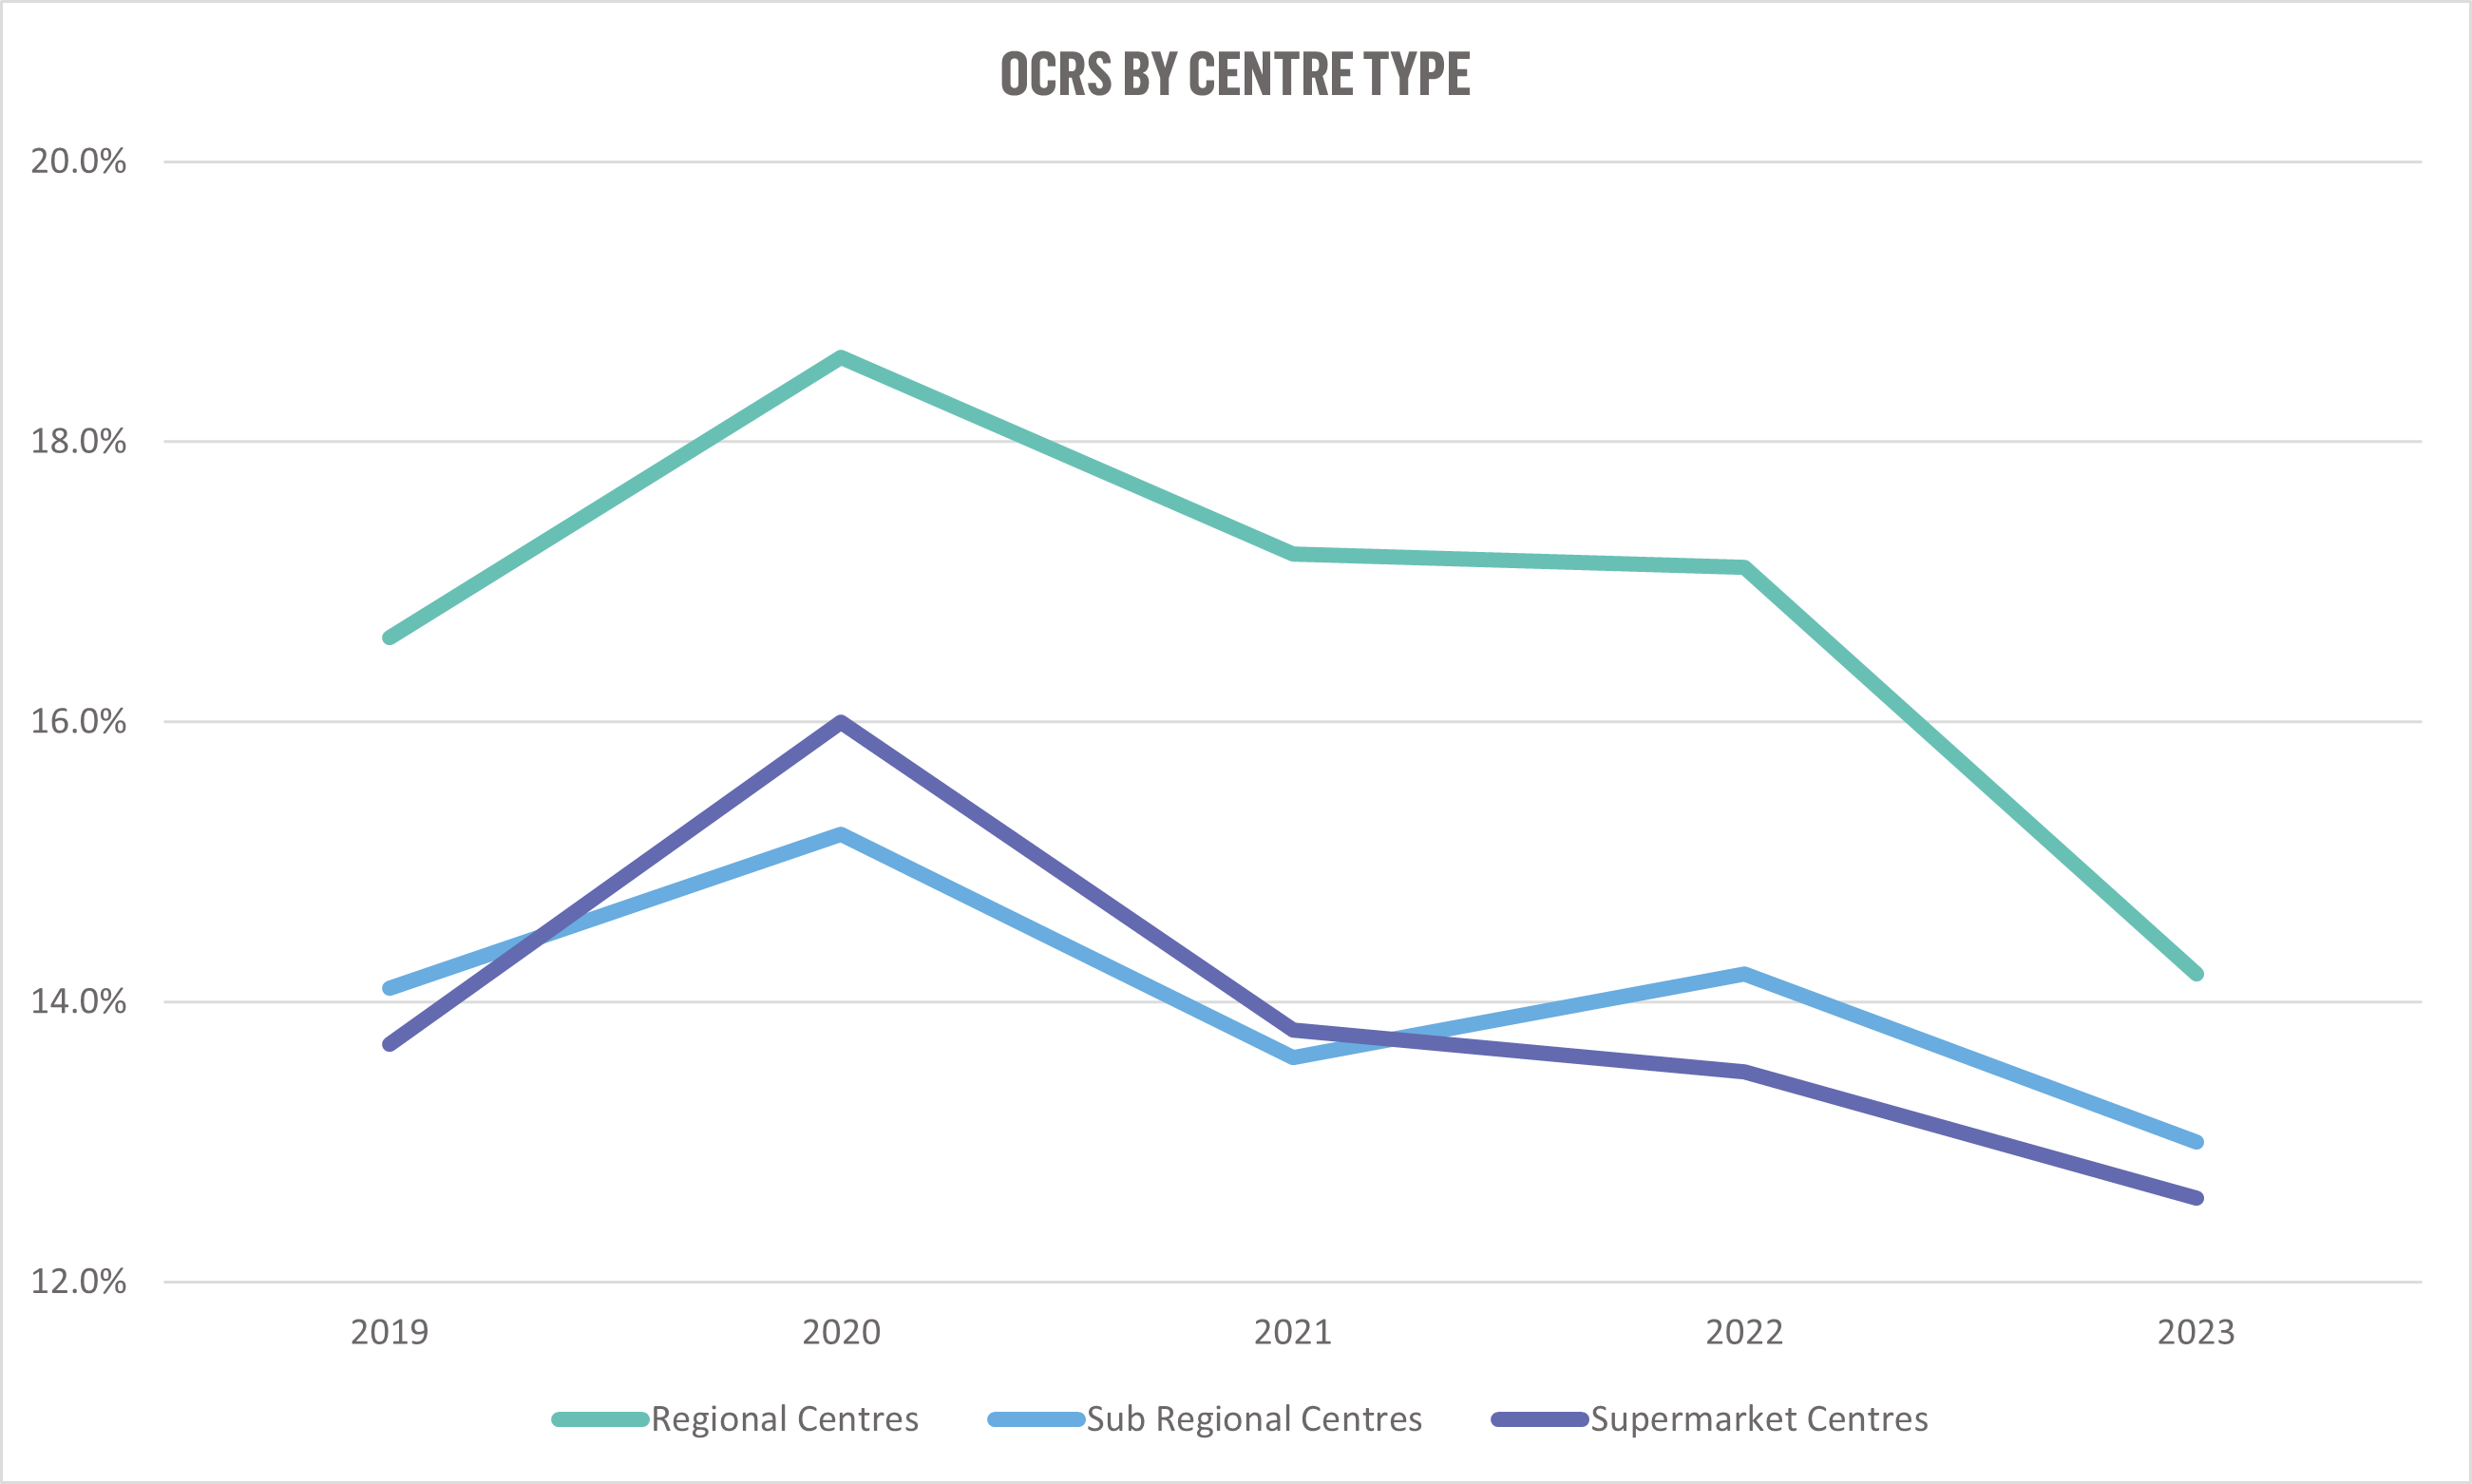
Following very challenging years in 2020, 2021 and 2022, where rents fell up to 5% below 2019 levels, regional centre rents did rebound in 2023, but to only 2% above 2019 levels. Sub-regional and supermarket centre rents were 5% and 3% above 2019 levels, respectively. Clearly, regional centre rents, in particular, have not kept pace with turnover growth. It is to be expected that rental growth would lag MAT somewhat, but this also suggests landlords have taken a balanced approach to rent increases, prioritising retailer health and sustainability following the tumultuous pandemic/post-pandemic period. Muted rental growth in 2023 has had a significant impact on Occupancy Cost Ratios (OCRs). In 2019 and throughout the COVID years, regional centre OCRs mostly tracked at 16-17%. In 2023, they fell to only 14%.
The fall in regional OCRs in 2023 has notably reduced the traditional OCR ‘premium’ enjoyed by regional centres.In 2019, the difference between regional centre and sub-regional/supermarket centre OCRs was 2-3%, ~17% vs ~14%. In 2023, the difference had fallen to only around 1%, 14% vs ~13%. It is worth noting, OCRs are down across all centre types compared to 2019 but, relatively speaking, regional centres have seen much larger falls. The clear opportunity for regional centre landlords is to successfully leverage MAT gains to deliver rental increases.
Variation in performance among regional centres is widening
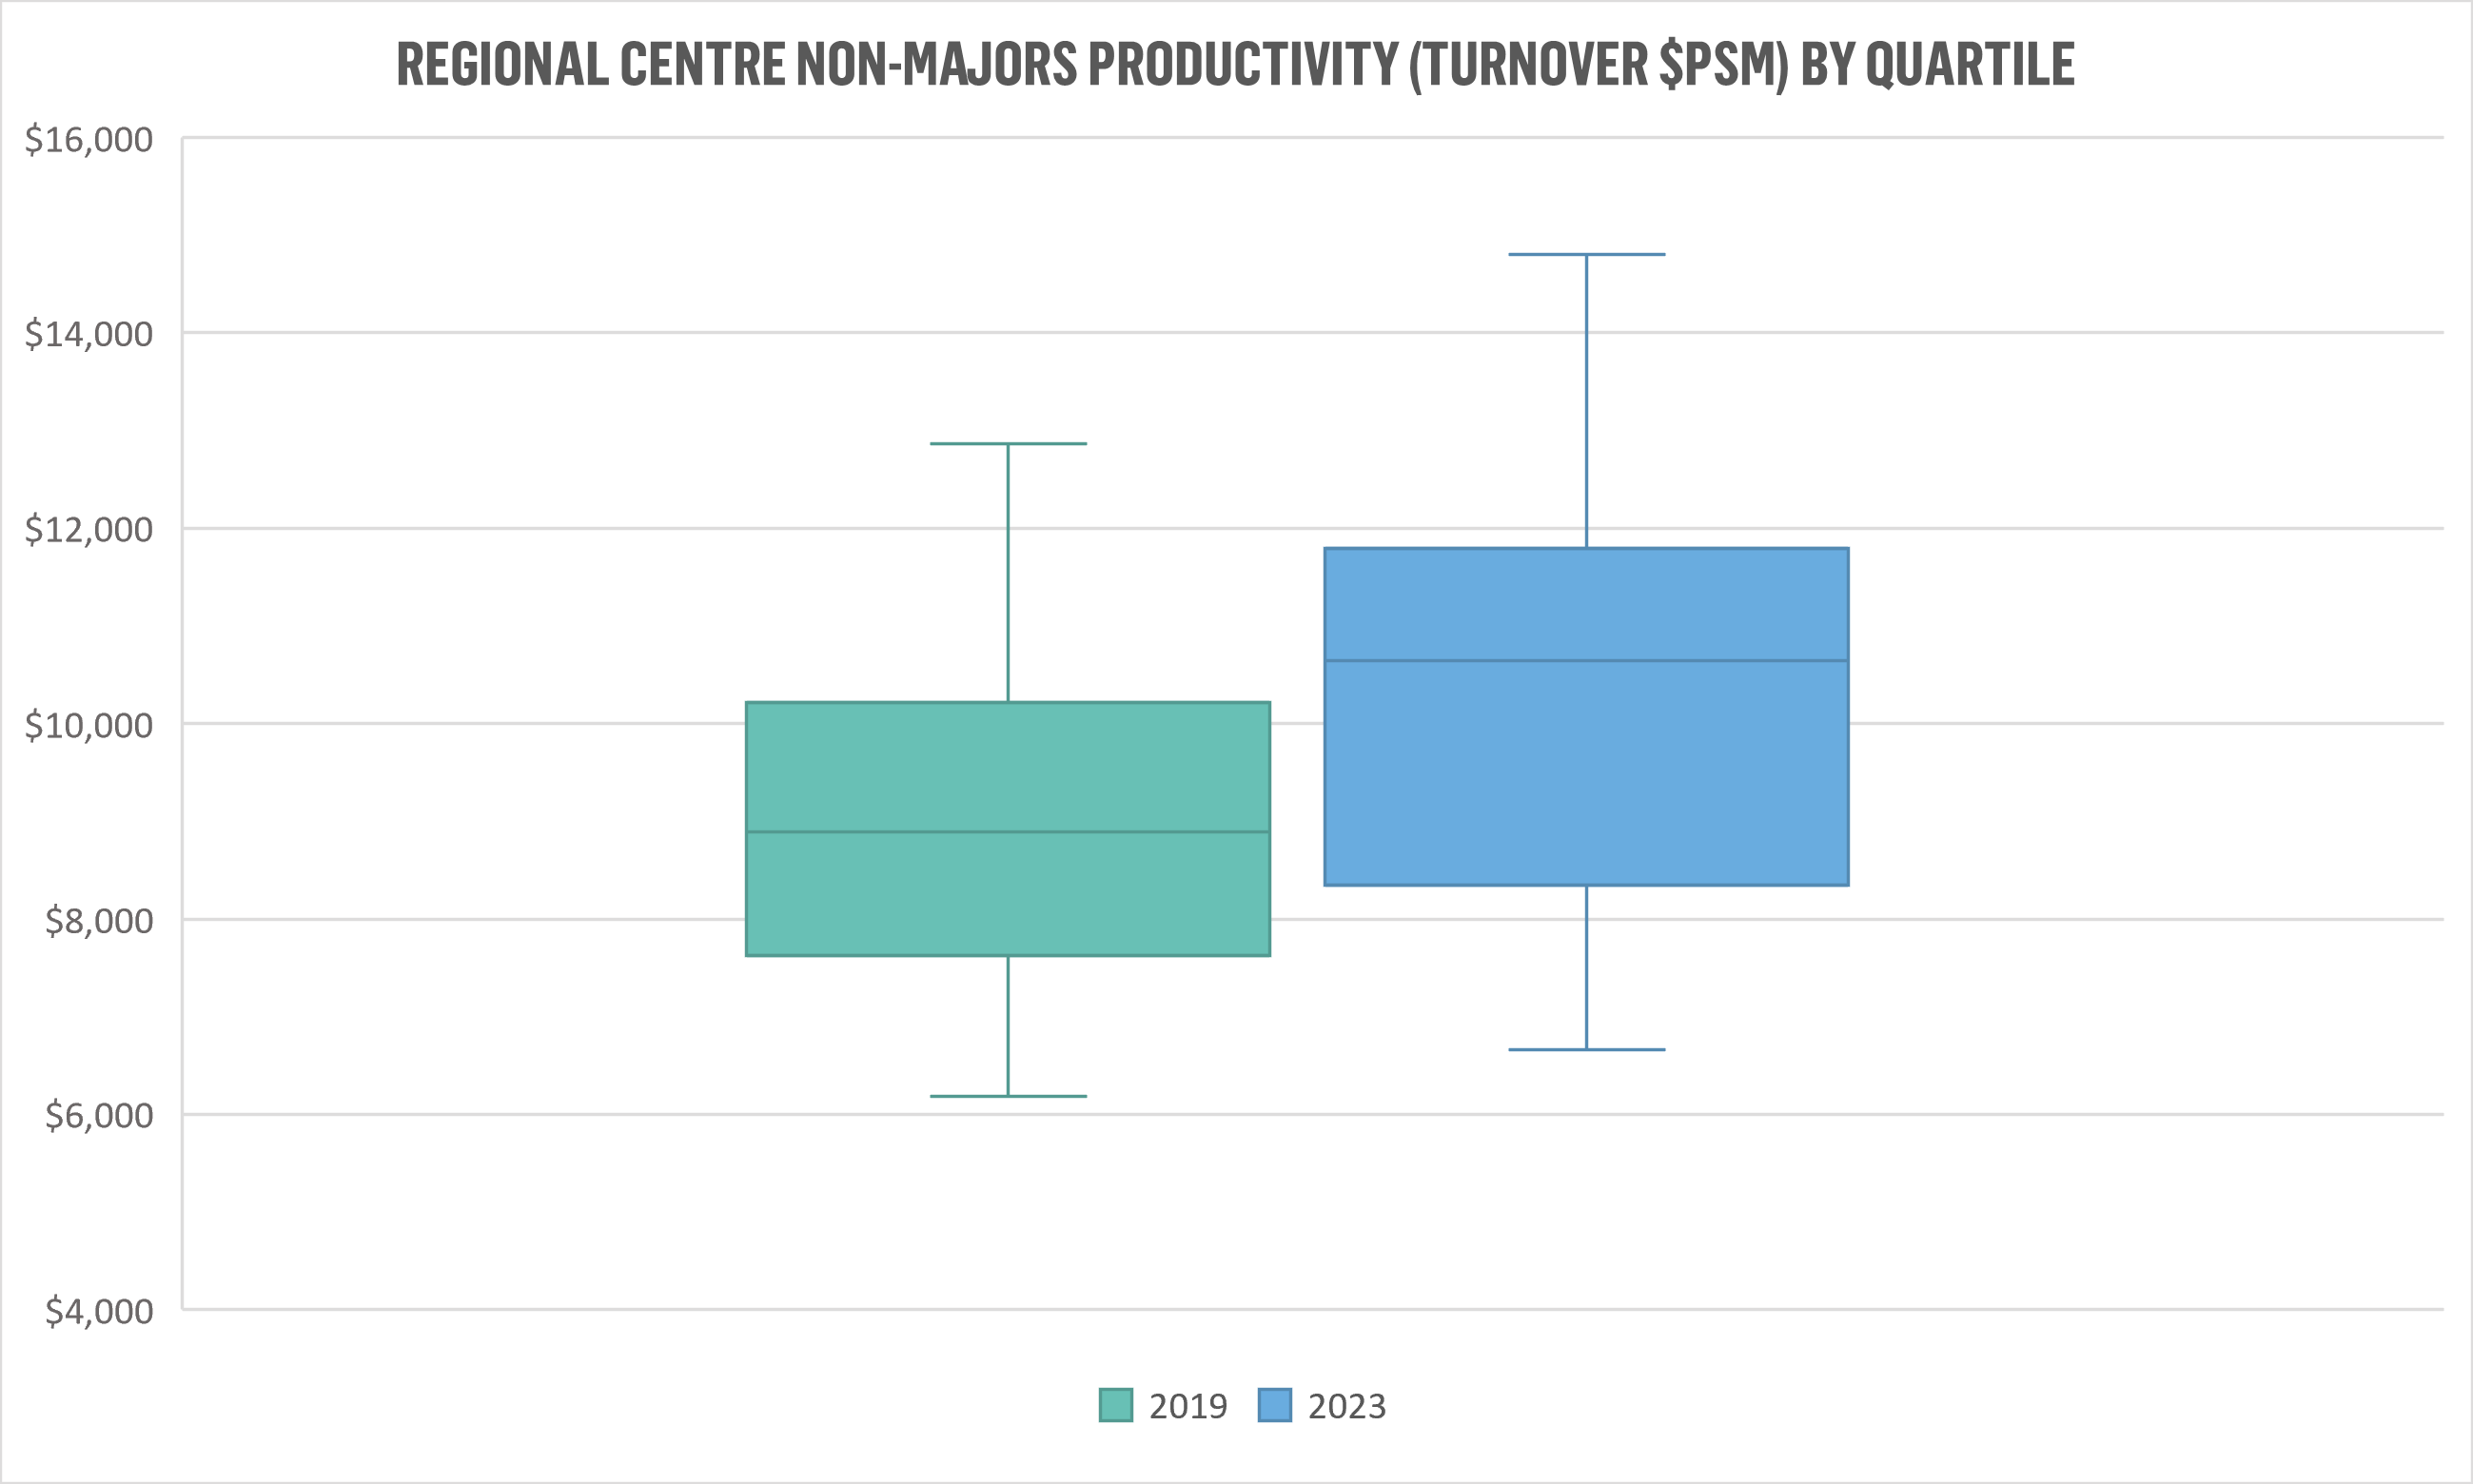
While overall, 2023 saw regional centres enjoy strong growth and most centres experienced at least some uplift, there were clear winners and losers. The gap between the better and worse-performing regional centres widened. The top quartile of regional centres saw MAT/m2 increase by 17% between 2019 and 2023; the figure for the bottom 25% was only 10%. The difference in MAT/m2 between the bottom and top 25% of regional centres has now blown-out to $3,500, 44% higher than it was in 2019.
Custom benchmarks can give insight into the drivers of centre performance
Urbis Shopping Centre Benchmarks can be customised in many ways, providing a more precise understanding of an individual centre’s performance. For instance, regional centres in high income areas (based on a 5km radius) and excluding outliers, perform notably better, with the top ten centres based on household income achieving MAT/m2 rates 27% higher than the bottom ten centres. The difference in rents is even greater, at 34%. All things being equal, regional centres in more affluent areas should be outperforming their counterparts in lower-income areas. While 27% is a big difference, variance in household income is only one of many factors impacting centre performance. Other factors, like competition, accessibility, proximity to workers, student and tourist populations, etc, all impact performance overall and at the individual category level.
Analysis of Urbis Shopping Centre Benchmarks data details a period of flux, with variation in retail composition and an expanding non-retail role changing the face of regional centres. Pandemic pressures impacted performance, but 2023 saw regional centres surge back to life, overtaking their pre-COVID levels of productivity. After assuming a pragmatic approach to rent increases throughout the pandemic recovery, there is opportunity for landlords to claw back OCRs, especially if regional centres’ strong performance continues into 2024.
However, Urbis Shopping Centre Benchmarks data illustrates an increasing divergence in performance among regional centres; historically, high-performing assets enjoyed a stronger rebound than those with traditionally lower productivity.
There are many factors that influence centre performance; in this sense, while overall benchmark data provides rich insights into regional centres as a whole, specific, customised benchmarks offer a better measure of performance at the individual centre level.


