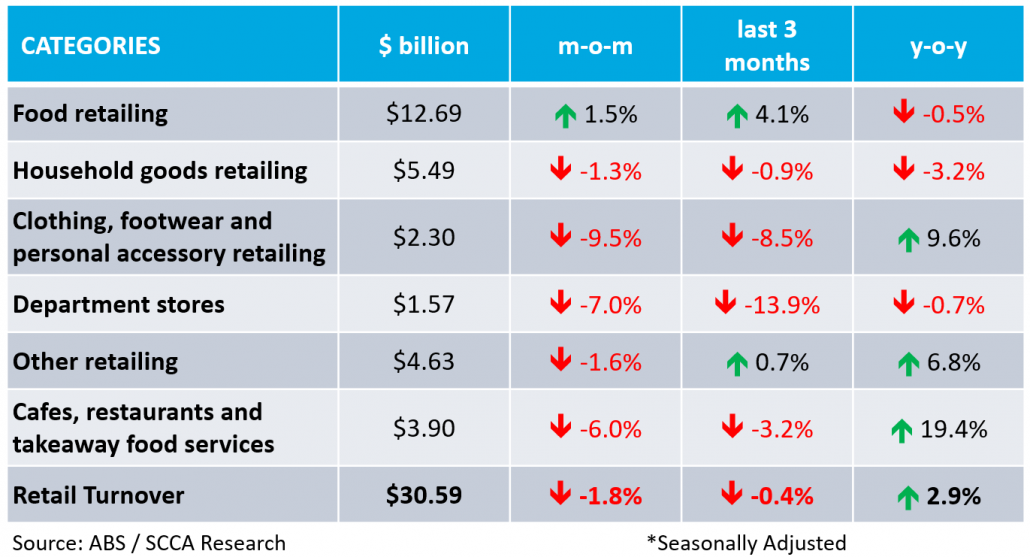
The latest release (June 2021) of the monthly ABS Retail Trade data indicates that the overall month-on-month (m-o-m) estimate* decreased by 1.8%, down from 0.4% in May 2021. Retail Turnover increased by 2.9% year-on-year (y-o-y), down from 7.7% in the prior corresponding period (pcp) noting the impact during the period of ‘retail hibernation’ commencing April 2020.
The following table summarises the key data in seasonally adjusted terms across the six ABS retail categories. The strongest growth was recorded for ‘Food’ retailing on a m-o-m basis (1.5%). ‘Cafés, Restaurants & Takeaway Food’ retailing recorded the strongest growth on a y-o-y basis (19.4%). In seasonally adjusted terms, Retail Turnover decreased by 1.8% in the month of June, down from 0.4% in May 2021. On a y-o-y basis, Retail Turnover increased by 2.9%, down from 7.7% in the pcp.
“Retail spending is up 2.9% in June 2021, compared with last year. This is quite an achievement given the strong growth in retail spending in June 2020 (up 8.4% vs. 2019). Whilst it is still too early to tell what effect current lockdowns will have on short-term figures, we know that retail spending bounces back strongly following Government imposed restrictions.” said Simon Hemphill, Head of Research, Shopping Centre Council of Australia.
Trend analysis: chain volume measures
The quarterly chain volume measure estimates the change in value after the direct effects of price changes have been eliminated, reflecting changes in volume. In the quarter to June 2021, Chain Volume Measures increased by 0.8%, up from -0.5% in the pcp. Retail Turnover decreased by 0.4% in the June 2021 quarter, down from 0.8% in the pcp. Chain Volume Measures are tracking slightly ahead of Retail Turnover indicating that volume is the main driver of growth.

State by State: best and worst
Retail Turnover varies within the ABS defined six categories and across different jurisdictions. The following map outlines and compares the total and growth of retail trade over the last 12-months (vs. the pcp), and the best and worst retail growth categories.
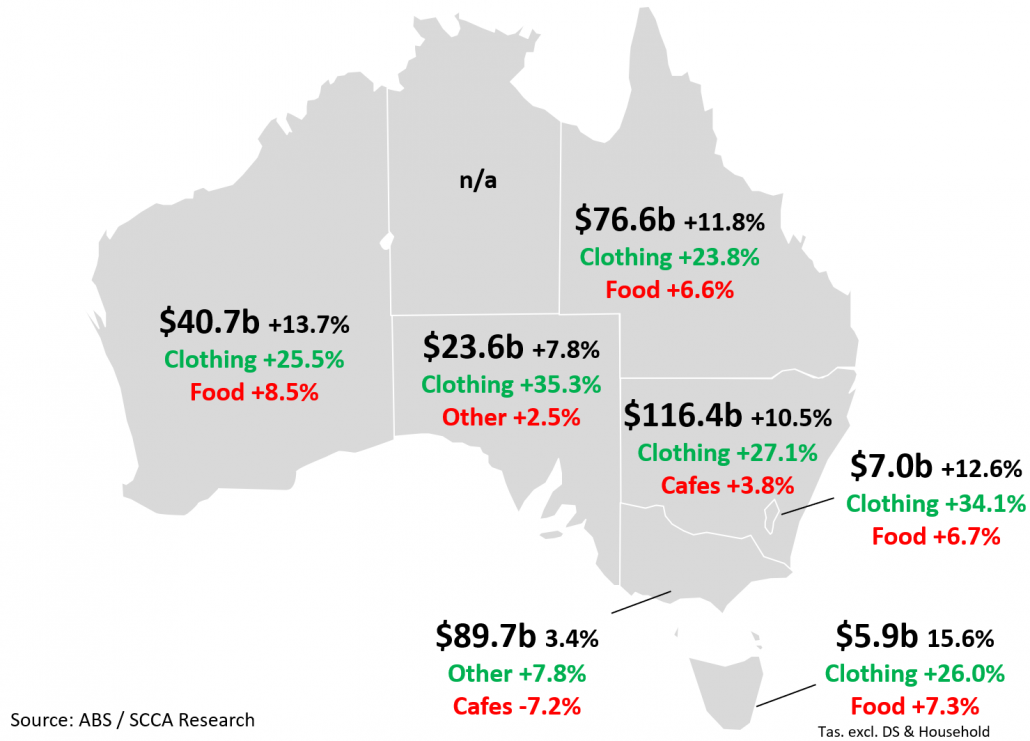
The strongest jurisdictions in seasonally adjusted terms were Tasmania (up 15.3% to $5.9 billion) followed by Western Australia (up 13.7% to $40.6 billion) and the ACT (up 12.6% to $7.0 billion). Victoria (up 3.4% to $89.7 billion) was the ‘worst performing’ jurisdiction, although still recording strong positive growth, following months of severe restrictions on retail trade. The highest growth across all jurisdictions, with the exception of Victoria, was for ‘Clothing, footwear and personal accessory’ retailing. Indeed, strong growth for clothing retail averaged 28.6% across six jurisdictions. It is worth noting that just one jurisdiction (Victoria) recorded ‘negative growth’ for the worst performing category, whilst all others recorded positive growth across all six categories.
* The ABS has temporarily suspended the publication trend data due to volatility.


